
(1/9) MRV Proxies for EW? A Guided Tour Through Our Data From Our Two-Year Greenhouse Experiment
Total alkalinity, electrical conductivity, and pH as MRV proxies for enhanced weathering — what we did, why we did it, and how to read this series
Enhanced rock weathering (EW) is one of the most promising carbon dioxide removal (CDR) approaches we have. The core idea is conceptually simple: spread reactive silicate (or carbonate) minerals on land, let them dissolve faster than they would naturally, and allow that dissolution to convert atmospheric CO₂ into dissolved inorganic carbon — mainly bicarbonate — that can ultimately be transported to long-term storage.
In practice, the hard part is not the spreading. The hard part is monitoring, reporting, and verification (MRV). EW signals are often subtle, soils differ wildly, and the measurements that matter most can be expensive and slow.
This guided tour is based on our multi-year greenhouse dataset (2023/2024/2025): hundreds of lysimeter pots, dozens of soil–feedstock combinations, and thousands of monthly leachate chemistry measurements. The central question throughout the series is:
Can we track EW-driven alkalinity generation (our chosen “ground truth” for CO₂ capture) with cheaper, easier-to-measure proxies — especially electrical conductivity (EC)?
In the scientific document that accompanies this blog series (PDF, 4 MB, DOI https://doi.org/10.13140/RG.2.2.23232.39688), we tested in a data deep dive whether the relationships between leachate EC, total alkalinity (TA), pH, and other chemistry variables can serve as potential proxies for mineral weathering and alkalinity generation.
The headline findings are:
At the full dataset level, EC correlates extremely strongly with TA (Pearson r ≈ 0.95) — basically as tightly as lab-measured Ca²⁺ and Mg²⁺ concentrations.
But on the level that matters for real projects (individual soil–feedstock combinations), that nice global relationship can break down, sometimes completely.
Nevertheless we found that we could have reduced our TA measurement work by up to 50% by synthesizing every second TA measurement from our EC data series.
That tension — “great macro-scale performance, messy micro-scale reality, but helpful nevertheless” — is what this series is about.
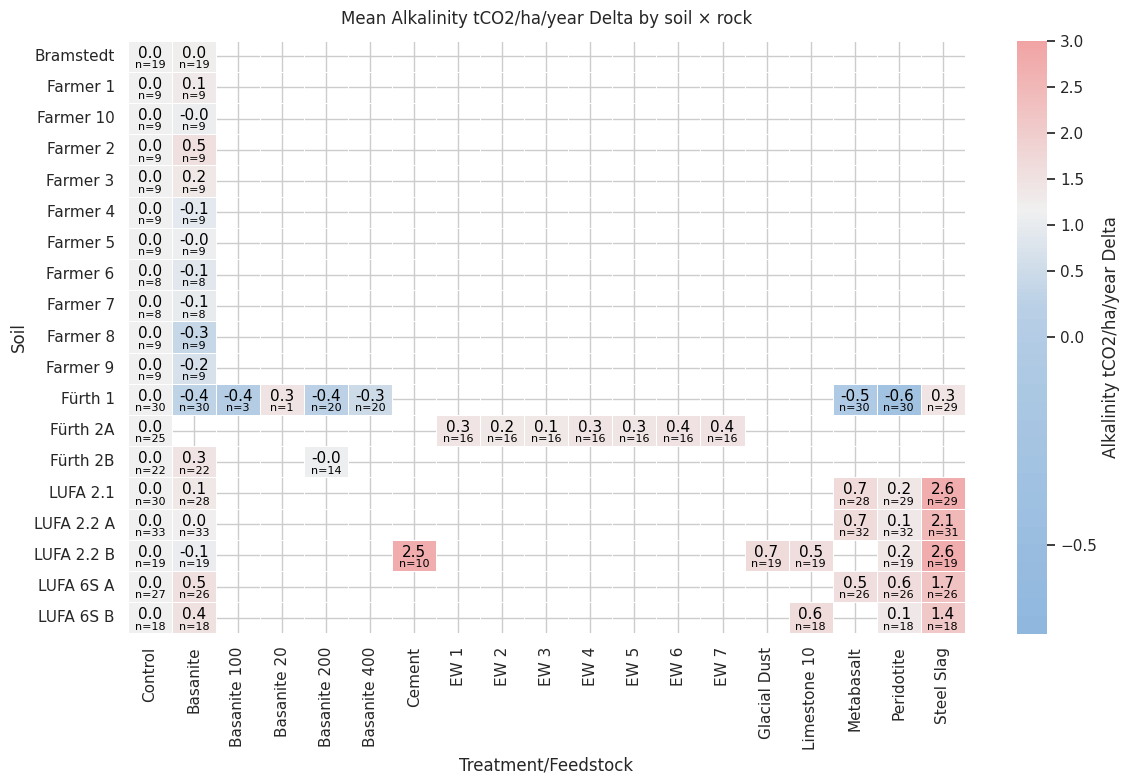
Figure 1: Mean annual CDR performance over 2 or 3 years by soil–feedstock treatment (tCO₂/ha/year), shown as delta vs. control. Values between −0.2 and +0.2 are not considered statistically significant. This is the “map” we’ll unpack in Part 2.
Why total alkalinity is our anchor metric
EW removes CO₂ by accelerating dissolution of silicate or carbonate minerals through land application of reactive feedstock dust. As minerals weather in CO₂-rich soil water, they release base cations (Ca²⁺, Mg²⁺, Na⁺, K⁺) and generate alkalinity. That alkalinity effectively represents CO₂ captured in aqueous phase (mainly as bicarbonate).
In our work, the increase in total alkalinity (TA) in leachate is treated as the primary indicator of CO₂ sequestration at the observed pH range (see our blog and Hammes, et al. (2025)). Concretely, we focus on the delta in TA between a control and a treatment as the main performance signal for EW-CDR.
A tempting shortcut in field MRV is: “TA measurements are expensive, so let’s just do fewer of them.” The problem is that few measurements are snapshots. As others have noted, alkalinity export is dynamic; capturing the total flux would require continuous or near-continuous monitoring — which is difficult and costly with current approaches. This is why proxies matter.
Why EC is such an attractive proxy candidate (and why it’s tricky)
Electrical conductivity is appealing because:
it reflects total dissolved ions in a water sample
it can be measured continuously with inexpensive sensors
it is logistically simple compared to titrations and lab chemistry
Past studies have reported co-variation of TA and EC, and field/column experiments have shown correlations between the two. The logic is straightforward: if cation release from mineral dissolution is balanced by bicarbonate formation, both TA and total ions rise together — and EC rises with them.
But EC is also blunt. It responds to all ions — including fertilizers and native salts that do not contribute to alkalinity. So an EC–TA relationship can be meaningful, but it must be calibrated for each site and likely even for each measurement location. Calibration also needs to be revisited after disturbances (fertilizing, extreme weather events, tilling, etc.). That calibration question is exactly what our dataset helps explore.
The experiment in one paragraph
We ran a multi-year controlled greenhouse lysimeter experiment to identify low-cost proxy measurements for TA in leachate. The full design was: 18 soils × 16 dust treatments (soils and feedstocks) across dozens of combinations, with hundreds of soil columns sampled repeatedly over time. Leachate was collected roughly monthly, and we measured TA, EC, pH (and more) to see which variables track alkalinity best.
Materials & Methods (the details that the rest of the series builds on)
Experimental design: soils, feedstocks, and lysimeters
We used large custom-made soil lysimeter pots in a controlled greenhouse.
Soils: 18 agricultural soils from Germany, spanning sandy to clay-loam textures and varying organic matter content (details in Appendix B).
Feedstocks: 18 crushed feedstock dusts/rates (mostly silicate rocks such as basalts/basanites and peridotite, plus alkaline industrial byproducts like steel slag; for simplicity we refer to all as “feedstocks”).
Lysimeters: average diameter ≈ 25.6 cm, height 26.3 cm, containing ~10 L soil each.
Application rates: 40 tonnes/ha equivalent (limestone at 10 t/ha; basanite also tested at 20, 100, 200 and 400 t/ha). Feedstock was mixed into the top 15 cm.
Replication: each soil–feedstock combination had at least four replicate pots (some up to 7); each soil also had at least four replicate controls without feedstock.
All pots were planted with Lolium perenne (grass), cut roughly monthly, watered regularly with cistern rainwater (monitored), and kept above 19 °C year-round. Depending on treatment start date, runs were 12–36 months, capturing both an early “flush” phase and longer-term signals.
Leachate collection and measurements
Each pot collected the entire drainage water (leachate). Over three years we had 32 sampling events.
At each sampling event we recorded volume and measured immediately on-site:
EC (µS/cm)
pH
temperature
dissolved oxygen
We manually analyzed total alkalinity (TA) on-site via acid titration to pH 4.3. Quarterly, subsamples were analyzed externally for major cations/anions (ICP-MS) and occasional DOC.
Disturbances we explicitly removed
Two periods strongly distorted the EC–TA relationship:
Initial post-setup phase (≈ day 0–90): We saw a flushing of soluble salts and nutrients after setup disturbance and re-wetting of the soils (the “Birch effect”), which is not representative of stable weathering-driven alkalinity export.
Post-fertilizer period (≈ day 200–250): A uniform nitrogen fertilization event (total mass 367 kg/ha including 133 kg/ha N) introduced a transient pulse of dissolved salts that spiked EC without a corresponding TA increase.
For proxy analysis, we removed these outliers. After filtering, we had over 3,600 valid leachate samples for correlation analysis.
Analytical approach: macro-scale vs micro-scale
We treat measured leachate TA concentration as the ground-truth indicator of CO₂ capture via EW.
Then we ask, in two ways:
Macro-scale: across the pooled dataset, what correlates with TA?
Micro-scale: within each soil–feedstock combination, does the relationship hold consistently?
We used Pearson correlation coefficients and repeated the analysis at both levels. Data processing was done in Python/Pandas (code and data referenced in the document).
How this series is structured
Everything above is the shared foundation. From here on, each post follows one section of the scientific document and focuses on one “MRV-relevant” insight:
MRV Proxies for EW? A Guided Tour Through Our Data From Our Two-Year Greenhouse Experiment
Part 2: Carbon Removal via Weathering and Treatment Variability
Part 3: Transient Disturbances: Initial Flush and Fertilizer Event
Part 7: EC’s Proxy Performance for Individual Treatments (Micro-Scale)
Download our scientific data report as PDF (Pre-Print)
Download the full PDF companion report (PDF, 4 MB, DOI https://doi.org/10.13140/RG.2.2.23232.39688) which is the reference backbone for the series. The data is available on Github https://github.com/dirkpaessler/carbdown_greenhouse_2023_2024 and via DOI https://doi.org/10.5281/zenodo.18360183.