
(3/9) Transient Disturbances: Initial Flush and Fertilizer Event
We recommend starting with the intro in Part 1 of this series.
The hidden MRV trap: EC can spike hard without any added alkalinity
While recording EC over two years, we observed two phases of exceptionally high EC values without accordingly increased TA values — both in control and treatment pots. One phase happened right at the beginning. The other occurred in September/October 2023.
If you only take away one lesson from this post, make it this: Not every EC increase is weathering. Sometimes it’s just salts.
Plotting the ratio of EC to TA over time (over 1000 days, in Figure 2) is a simple way to see when the proxy relationship is behaving — and when it is not.
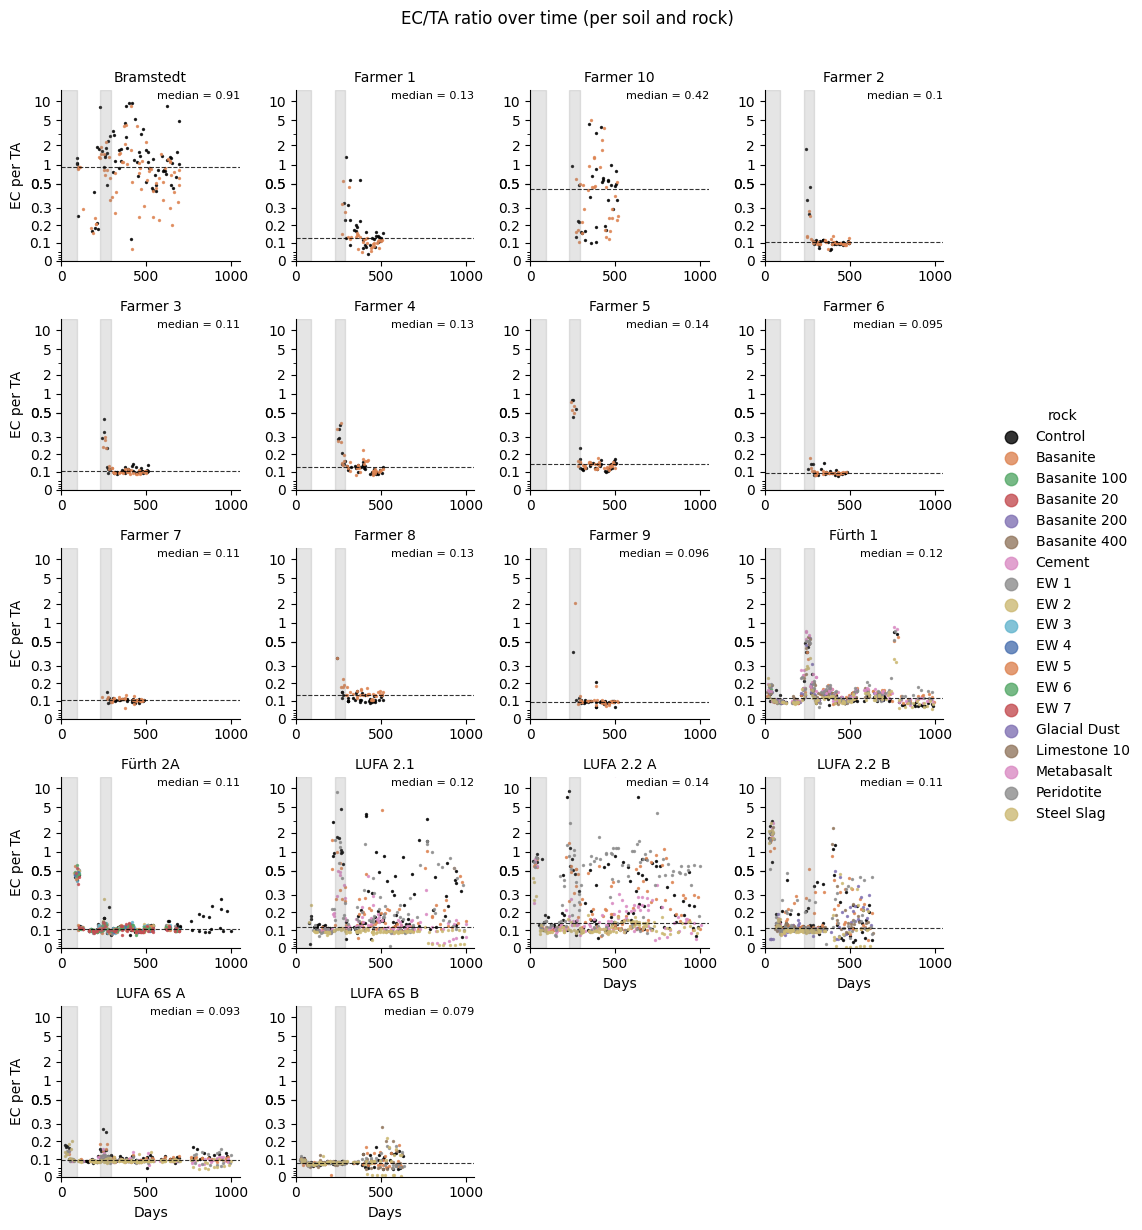
Figure 2: Unfiltered time series of EC/TA ratio ((µS/cm)/(µmol/L)) for all treatments (semi-log scale). Shaded regions: day 0–90 initial post-setup phase; day 200–250 period after fertilizer. Outside these intervals, many treatments converge to more stable EC/TA relationships.
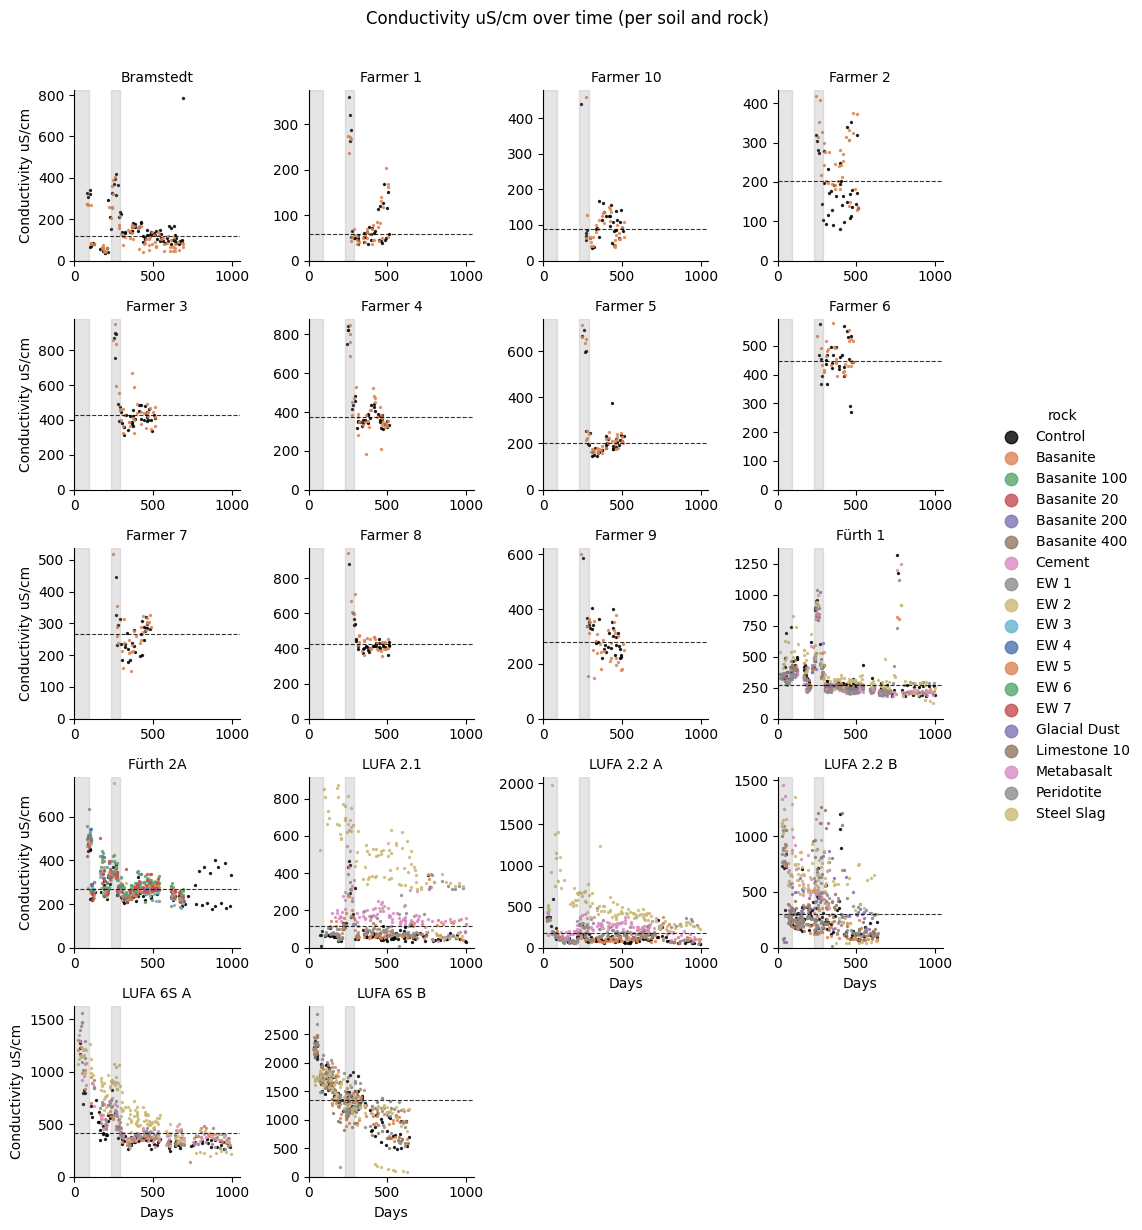
Figure A1: Time series of EC for all treatments. Same shaded disturbance periods. Note changing y-axis scales.
Disturbance #1: the initial “settling phase” (Birch effect)
In the first 2–3 months after setup, EC and TA were often decoupled. Many variations showed high EC/TA ratios during this phase, likely due to flushes of pre-existing salts or rapid mineralization of soil organic matter, likely induced by disturbing the soil (homogenising and shoveling it into our pots) and re-weeting the soil after setup — the so-called Birch effect.
This period reflects a short-term microbial and geochemical response to disturbance (sieving, drying, rewetting), not the long-term EW signal we care about.
From an MRV perspective, it’s the equivalent of measuring immediately after tillage and thinking you’re seeing long-term system behavior. Essentially the first 1-3 months of weathering experiments may likely not be representative of the long-term results.
Disturbance #2: the fertilizer pulse (EC jumps, TA doesn’t follow)
Around day 200, we applied a uniform nitrogen fertilization event to support plant growth.
The result: the EC/TA ratio spiked dramatically for most variations, again for both controls and treatments. The fertilizer (rich in nitrate, phosphate, and other salts) introduced ions that increase EC but do not directly add alkalinity — temporarily skewing the EC vs TA relationship.
Importantly, irrigation water was monitored and consistent. This was not a water-source artifact. After the salt pulse leached out (less than ~60 days), EC/TA ratios returned to baseline for most soils.
Two soils, however — Bramstedt (peat-rich) and “Farmer 10” (low pH) — never converged to a stable EC/TA ratio.
What this means for MRV of enhanced weathering in practice
1) EC sensors are excellent “anomaly detectors”
A sudden EC jump is a red flag. In the field, cheap EC probes can alert operators to:
fertilization events (planned or unreported)
dry/wet transitions, irrigation changes or salinity shifts
flushing events after disturbance
sensor drift or hardware issues
This is not trivial. A lot of MRV failure modes start with “something changed and we didn’t notice.”
2) Proxy relationships require re-calibration after chemistry shocks
Even if a site has a nice EC–TA relationship most of the time, a fertilization event can reset the chemistry for weeks. MRV systems that intend to use EC as a proxy need to treat these periods explicitly, either by excluding them from proxy estimation or by increasing TA sampling frequency to re-anchor the relationship.
3) “Stable ratio” is itself a site screening metric
In our data, some soils never settled into a stable EC/TA regime. That suggests that “does the ratio stabilize?” can be used as an early warning during project setup:
if it stabilizes, hybrid proxy strategies may be feasible
if it doesn’t, relying on EC alone is dangerous
Notably, the two soils with continuously broken EC/TA relationship (Bramstedt and Farmer 10) also did not exhibit any CDR performance
Read more…
MRV Proxies for EW? A Guided Tour Through Our Data From Our Two-Year Greenhouse Experiment
Part 2: Carbon Removal via Weathering and Treatment Variability
Part 3: Transient Disturbances: Initial Flush and Fertilizer Event
Part 7: EC’s Proxy Performance for Individual Treatments (Micro-Scale)
Download our scientific data report as PDF (Pre-Print)
Download the full PDF companion report (PDF, 4 MB, DOI https://doi.org/10.13140/RG.2.2.23232.39688) which is the reference backbone for the series. The data is available on Github https://github.com/dirkpaessler/carbdown_greenhouse_2023_2024 and via DOI https://doi.org/10.5281/zenodo.18360183.