
(8/9) Substituting TA measurements with EC measurements
We recommend starting with the intro in Part 1 of this series.
A practical MRV cost lever: keep TA as ground truth, but use EC to fill the gaps
If EC correlates well with TA (at least under stable conditions), then the obvious next question is: Can we reduce expensive TA titrations by substituting some of them with EC-derived “synthetic TA” values, without losing accuracy in cumulative CDR accounting? In our workflow, the CDR effect of a treatment is based on the delta in accumulated bicarbonate flux between treated pots and their controls over the experiment duration. In our leachate-based framing, that equals the delta in accumulated TA flux.
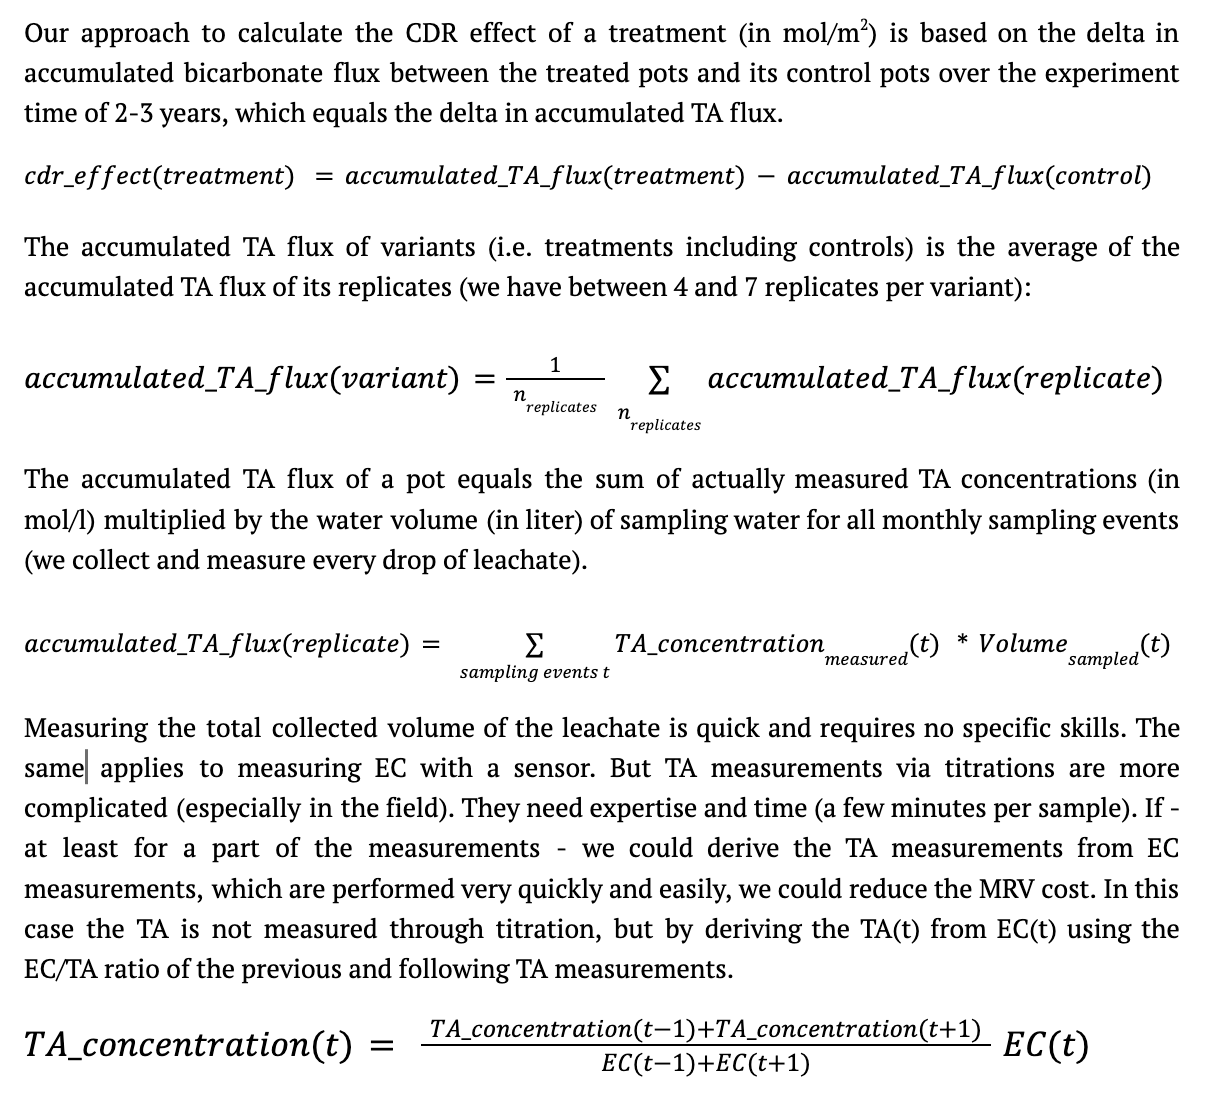
The practical result: you can substitute roughly every second TA measurement, reducing titrations by up to 50%.
How much error does this introduce?
We quantified error on alkalinity over several years (because cumulative flux is what matters for CDR accounting).
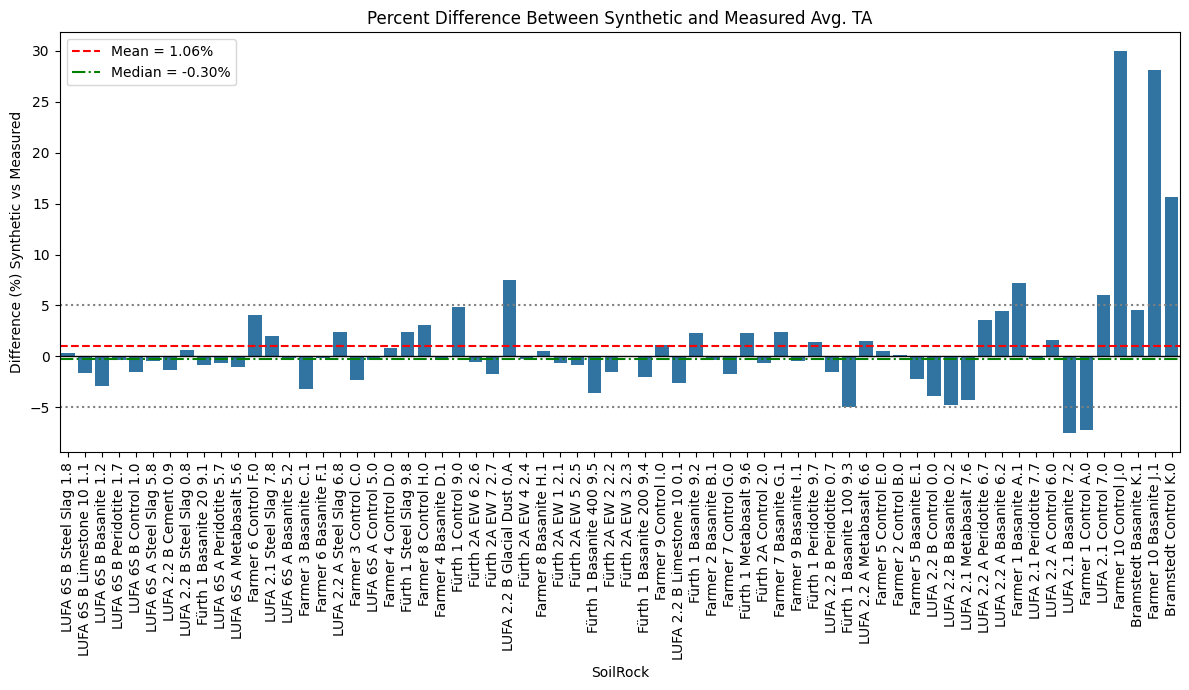
Figure 11: Relative error (%) for alkalinity over 1-3 years when every second TA measurement is replaced by a synthetic TA value computed from EC.
For most variations, the error for accumulated TA flux was under ~5%. A small number of variations showed huge errors — notably Bramstedt and Farmer 10, which already showed unstable EC/TA behavior earlier.
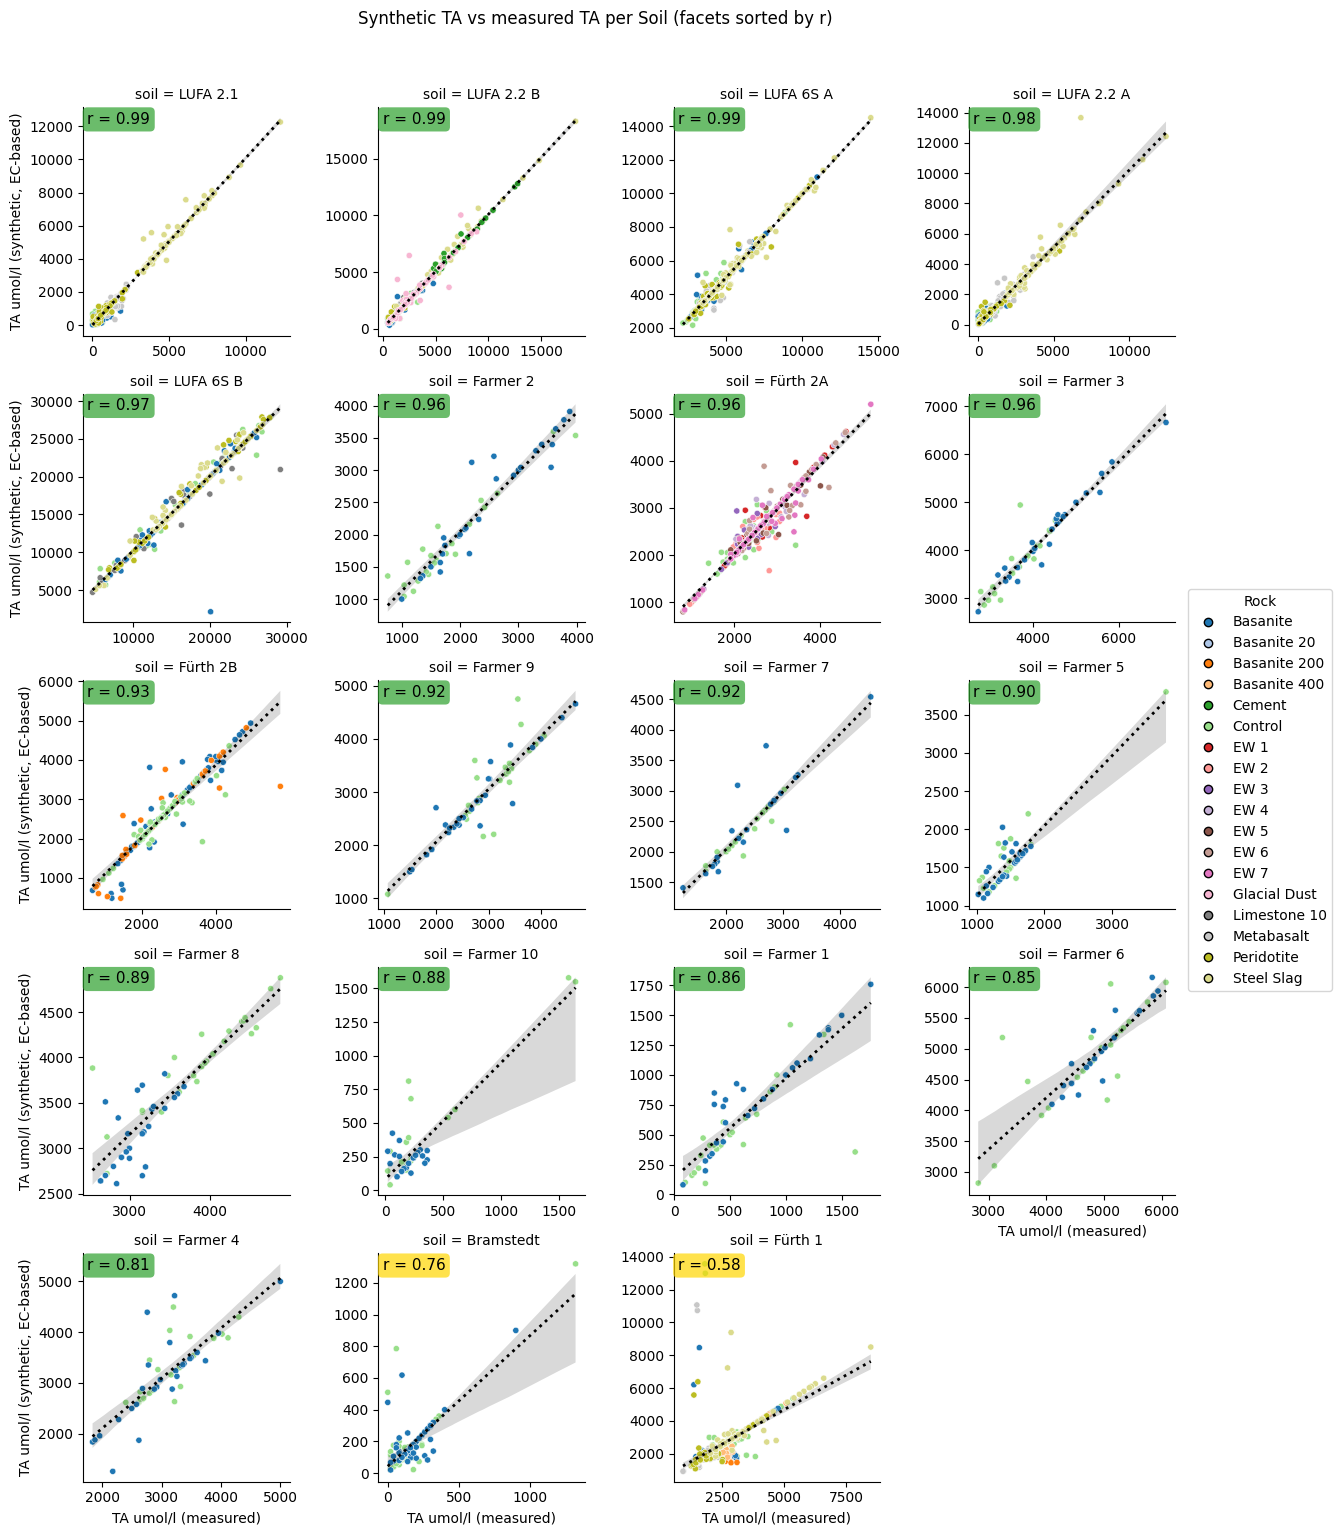
To visualize synthetic vs measured TA directly:
Figure 12: Synthetic TA values plotted over measured TA values, by soil and treatment.
What this means for MRV of enhanced weathering in practice
A realistic hybrid MRV pathway
This could be a practical MRV takeaway: A combined approach of continuous (or frequent) EC measurements plus intermittent TA titrations can reduce cost and workload substantially, while keeping cumulative CDR estimates close to what full TA sampling would produce.
It should be noted that our synthetic TA signal was also reasonably good during the initial flushing phase and after the fertilizer event.
Read more…
MRV Proxies for EW? A Guided Tour Through Our Data From Our Two-Year Greenhouse Experiment
Part 2: Carbon Removal via Weathering and Treatment Variability
Part 3: Transient Disturbances: Initial Flush and Fertilizer Event
Part 7: EC’s Proxy Performance for Individual Treatments (Micro-Scale)
Download our scientific data report as PDF (Pre-Print)
Download the full PDF companion report (PDF, 4 MB, DOI https://doi.org/10.13140/RG.2.2.23232.39688) which is the reference backbone for the series. The data is available on Github https://github.com/dirkpaessler/carbdown_greenhouse_2023_2024 and via DOI https://doi.org/10.5281/zenodo.18360183.