
(2/9) Carbon Removal via Weathering and Treatment Variability
We recommend starting with the intro in Part 1 of this series.
The first MRV reality check: many treatments don’t show a detectable alkalinity signal
Before we talk about proxies, we need to talk about the signal itself.
In an EW project, the dream is: apply rock dust, weathering happens, TA goes up, and we can confidently quantify CO₂ removal. In our greenhouse data, that clean story only played out in a subset of cases.
Despite using feedstock powders that looked promising at the beginning, only a subset of the soil–feedstock treatments showed clear evidence of CO₂ sequestration in the form of increased leachate alkalinity over 1–3 years.
In numbers: out of 51 unique feedstock-amended treatments, only half (25 treatments, 49%) exhibited a statistically significant rise (> 0.2 tCO₂/ha/year) in TA relative to their unamended controls.
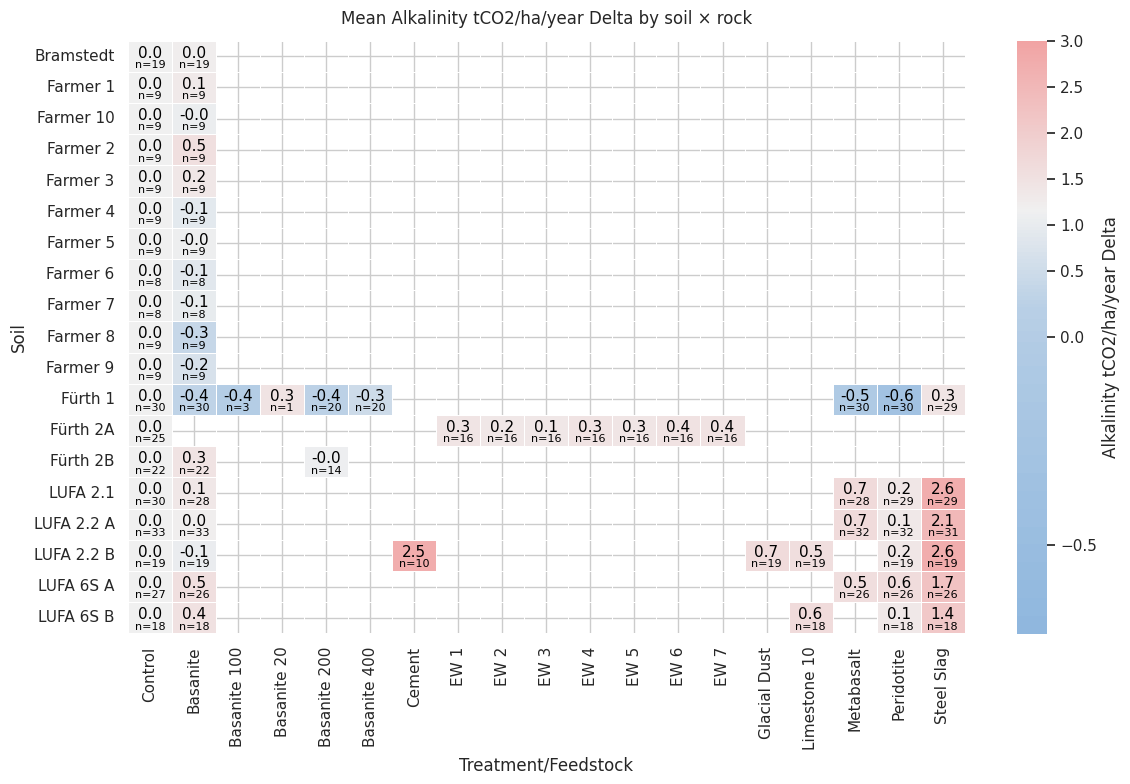
Figure 1: Mean annual CDR performance over 2 or 3 years per soil–feedstock treatment (tCO₂/ha/year), shown as delta vs control. Values between −0.2 and +0.2 are not considered statistically significant. Monthly TA concentrations were combined with leachate volumes to calculate bicarbonate mass fluxes, then annualized.
What Figure 1 actually reveals (beyond “some worked, some didn’t”)
1) EW performance is strongly pairing-dependent
Some feedstocks in some soils produced substantial increases in leachate alkalinity, while others — including the same feedstock in a different soil — produced negligible change. This matters because it tells us: MRV is not only about measuring well. It’s also about knowing when there is something measurable to begin with. If the treatment does not move TA relative to control beyond uncertainty, then any proxy, no matter how elegant, has very little to “lock onto”.
2) The measurable CDR range in this setup is real — but not guaranteed
In the responsive cases, the annualized TA increase corresponded to roughly 0.3–2.6 tCO₂/ha/year under our greenhouse conditions. There is no universal ranking of feedstocks, the soil matters. It is an observation in this experiment and can be different on different soils — but it gives a sense of the magnitude of signal that MRV methods must be able to detect.
3) Some treatments even show negative deltas
Some combinations showed minimal/no difference; some even showed negative alkalinity deltas (especially when combined with one specific soil, “Fürth 1”). Negative deltas are uncomfortable, but MRV systems must be able to represent them honestly. If we only design MRV to “prove positives,” we invite selection bias and over-crediting.
The important limitation: we can’t yet explain why the grid looks like this
Even in our large experiment, there are still many gaps in the soil × feedstock grid. With the current dataset, we cannot derive clean quantitative trends about which soil parameters exert the greatest control on ion and alkalinity export.
But the message is still clear: soil characteristics are not a footnote. They are often the main story.
That is also a warning shot for MRV planning. A proxy that works beautifully in one soil can be mediocre in another, not because the proxy is “bad,” but because the soil changes what happens to weathering products between dissolution and leachate export.
What this means for MRV of enhanced weathering in practice
MRV must be designed for “no-signal” scenarios
In our dataset, many treatments did not produce a significant TA rise within 1–3 years. In the field, that translates to a practical MRV problem:
You still need a method that can measure (and report) “no detectable removal” without ambiguity.
You need controls, baselines, and uncertainty treatment that do not accidentally turn noise into a credited signal.
Proxies are not magic — they amplify what exists
When TA deltas are small, correlations weaken because measurement variability and differences among replicates dominate. When TA deltas are large (strong weathering), correlations often become stronger because the signal-to-noise ratio improves.
This is the bridge to Part 7 later: in our data, weak EC–TA correlation at the micro-scale often goes hand-in-hand with weak CDR performance.
Your MRV plan should assume soil–feedstock specificity
Figure 1 is essentially a map of site specificity. For projects, that means:
calibrations must be local
controls matter
and “we’ve seen this proxy work elsewhere” is not enough
Read more…
MRV Proxies for EW? A Guided Tour Through Our Data From Our Two-Year Greenhouse Experiment
Part 2: Carbon Removal via Weathering and Treatment Variability
Part 3: Transient Disturbances: Initial Flush and Fertilizer Event
Part 7: EC’s Proxy Performance for Individual Treatments (Micro-Scale)
Download our scientific data report as PDF (Pre-Print)
Download the full PDF companion report (PDF, 4 MB, DOI https://doi.org/10.13140/RG.2.2.23232.39688) which is the reference backbone for the series. The data is available on Github https://github.com/dirkpaessler/carbdown_greenhouse_2023_2024 and via DOI https://doi.org/10.5281/zenodo.18360183.