
(6/9) Leachate Electrical Conductivity (Macro-Scale)
We recommend starting with the intro in Part 1 of this series.
EC tracks alkalinity extremely well — until you zoom in
In the aggregate dataset, electrical conductivity (EC) emerged as a strong predictor of total alkalinity. The Pearson correlation between EC and TA across 3,794 samples was r ≈ 0.95, almost matching the performance of Ca²⁺ and Mg²⁺. A simple linear regression of EC versus TA shows an overall linear trend across the dataset.
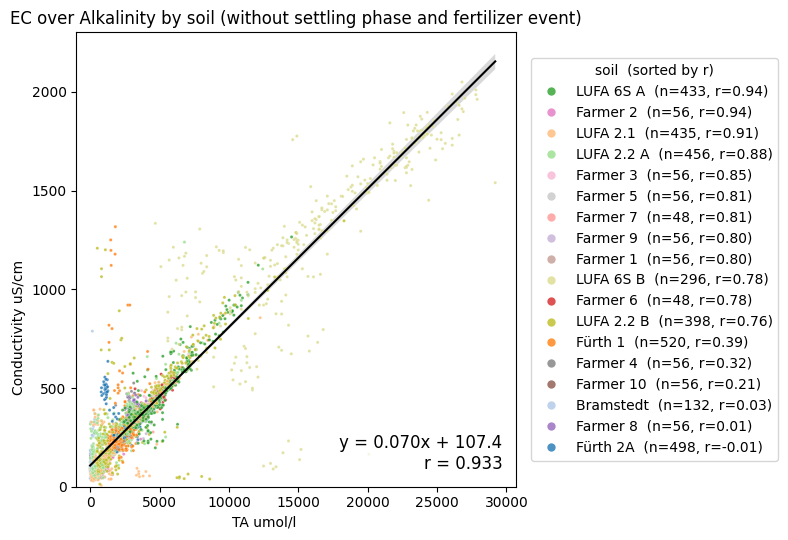
Figure 6: Scatter plot of EC vs TA for all 3,794 leachate samples (outlier periods removed). Each point is one measurement (colors represent soils). Regression line with 95% confidence interval. Overall trend is linear (r ~0.95), but certain soils systematically diverge.
What Figure 6 reveals (and why it matters)
1) The macro-scale relationship is real
At the pooled dataset level, higher EC corresponds to higher alkalinity. That is exactly what we want if we hope to use EC as a low-cost proxy for EW-driven alkalinity generation.
2) Soil-specific differences already peek through
Even in the pooled data, you can see hints that the EC–TA relationship depends on soil:
The highest TA values come from one soil (LUFA 6S B), while a closely related soil (LUFA 6S A) shows much lower readings.
Some soils systematically deviate from the pooled regression line (example noted in the document: some “Fürth 1” measurements show lower TA than expected for their EC).
This is the “foreshadowing” moment. At macro-scale, EC looks almost perfect. But MRV does not work well everywhere at macro-scale averages. It operates on specific sites.
That’s why the next step is micro-scale: does the relationship hold within each soil–feedstock combination?
What this means for MRV of enhanced weathering in practice
EC can be a cost reducer for MRV — if calibrated locally
Figure 6 suggests that EC can carry the alkalinity signal. If a project can establish a stable local EC–TA calibration, EC sensors could provide high-frequency monitoring that TA alone cannot.
“One universal regression” is not an MRV method
The soil-specific deviations in Figure 6 are exactly the kind of detail that can cause over- or under-crediting if ignored. If EC is used, it should be treated as a site-calibrated proxy, not a global formula.
Read more…
MRV Proxies for EW? A Guided Tour Through Our Data From Our Two-Year Greenhouse Experiment
Part 2: Carbon Removal via Weathering and Treatment Variability
Part 3: Transient Disturbances: Initial Flush and Fertilizer Event
Part 7: EC’s Proxy Performance for Individual Treatments (Micro-Scale)
Download our scientific data report as PDF (Pre-Print)
Download the full PDF companion report (PDF, 4 MB, DOI https://doi.org/10.13140/RG.2.2.23232.39688) which is the reference backbone for the series. The data is available on Github https://github.com/dirkpaessler/carbdown_greenhouse_2023_2024 and via DOI https://doi.org/10.5281/zenodo.18360183.