
(4/9) Proxy Correlations on Aggregate Data (Macro-Scale)
We recommend starting with the intro in Part 1 of this series.
When we pool 3,794 samples, EC looks almost “too good to be true”
After removing the initial flush and the fertilizer-affected period, we were left with 3.794 leachate samples. This is the dataset we used to evaluate how well different variables correlate with total alkalinity.
The result is summarized in one figure — and it is the reason EC keeps coming up as a serious MRV candidate.
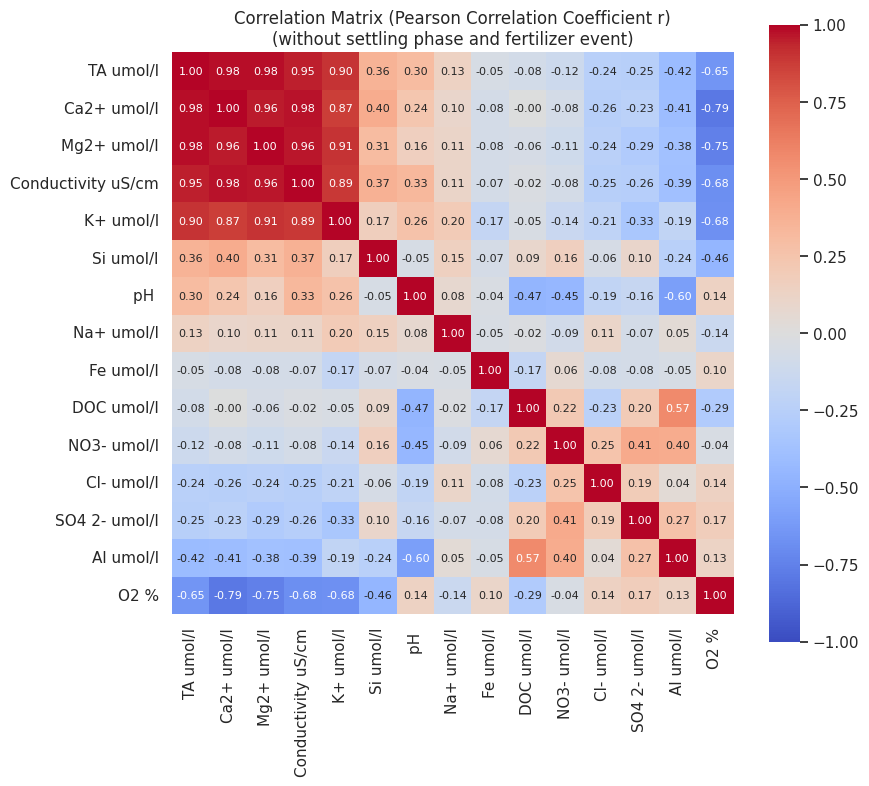
Figure 3: Correlation matrix (Pearson r) between TA and other measured variables (excluding outlier periods), based on 3,794 samples. TA correlates most strongly with Ca²⁺, Mg²⁺, and EC (r ~0.95). K⁺ is moderately correlated (r ~0.90). Many other variables show weak or no correlation.
What the correlation matrix tells us
Ca²⁺ and Mg²⁺ behave like “near-perfect” proxies for TA (in principle)
This is expected from basic stoichiometry. Dissolution of many EW-relevant minerals releases Ca²⁺ and Mg²⁺, and alkalinity generation is tightly linked to that cation release.
At the aggregated level, the data confirm this: Ca²⁺ and Mg²⁺ correlate with TA at r ≈ 0.98.
EC matches that performance at the macro-scale
The surprising and practically important result is that EC also correlates with TA at r ≈ 0.95 in the pooled dataset.
EC is much easier and cheaper to measure continuously than TA titrations or lab-based cation analysis. This is why it’s attractive for MRV scaling.
Many “intuitive” variables do not correlate with TA
Other measured ions and parameters (Na⁺, sulfate, nitrate, DOC, and even pH and Si in this dataset) showed weak or no correlation with TA. That means they are poor indicators of EW-driven carbon capture over the experiment period, at least in this setting.
What this means for MRV of enhanced weathering in practice
Macro-scale validation is encouraging, but it’s not a field-ready calibration
At the dataset-wide level, EC carries essentially the same signal as alkalinity under the conditions tested here. That suggests a potential MRV pattern:
continuous EC monitoring for dense time coverage
periodic TA and/or cation measurements for anchoring and recalibration
But a pooled dataset correlation is not a guarantee that the relationship holds reliably for a specific soil, crop, fertilizer regime, and climate. That’s why we later go micro-scale.
MRV should treat EC as a proxy of “ion export,” not a direct proxy of CO₂
Even when EC and TA correlate, EC responds to ions that do not represent captured CO₂. Fertilizers are the obvious example (Part 3), but native salts matter too. Therefore, EC can reduce cost — but only inside a calibration framework that keeps TA as the reference.
Read more…
MRV Proxies for EW? A Guided Tour Through Our Data From Our Two-Year Greenhouse Experiment
Part 2: Carbon Removal via Weathering and Treatment Variability
Part 3: Transient Disturbances: Initial Flush and Fertilizer Event
Part 7: EC’s Proxy Performance for Individual Treatments (Micro-Scale)
Download our scientific data report as PDF (Pre-Print)
Download the full PDF companion report (PDF, 4 MB, DOI https://doi.org/10.13140/RG.2.2.23232.39688) which is the reference backbone for the series. The data is available on Github https://github.com/dirkpaessler/carbdown_greenhouse_2023_2024 and via DOI https://doi.org/10.5281/zenodo.18360183.