When we set up our greenhouse experiment in 2023 we deliberately maximised weathering to get the strongest possible signal: we turned every dial to "11", soil held at 19–30 °C, plants growing throughout the year, and we aimed for a lavish ~2,000 mm of irrigation a year (in summer we even had to apply up to 4000 mm, because otherwise we would not have collected enough leachate to measure carbon removal). That poses two questions with a single answer: if we wanted these conditions outdoors, where would we go, and what real place did we recreate?
Enhanced rock weathering (ERW), spreading finely ground rock on soil so it dissolves and locks away CO₂, is a promising nature-based carbon-removal pathway, but its efficiency can only be assessed if you can actually see the signal. After two outdoor experiments with weak signals, we started a large greenhouse experiment deliberately causing the fastest weathering we could sensibly build.
Which raises the obvious question: our greenhouse is not a place, but if it were, where on Earth would it be? We matched its three-year climate record against every land pixel on the planet (WorldClim). The first surprise: it stands in chilly Bavaria, Germany, but climatically it is nowhere near it.
The machine we built
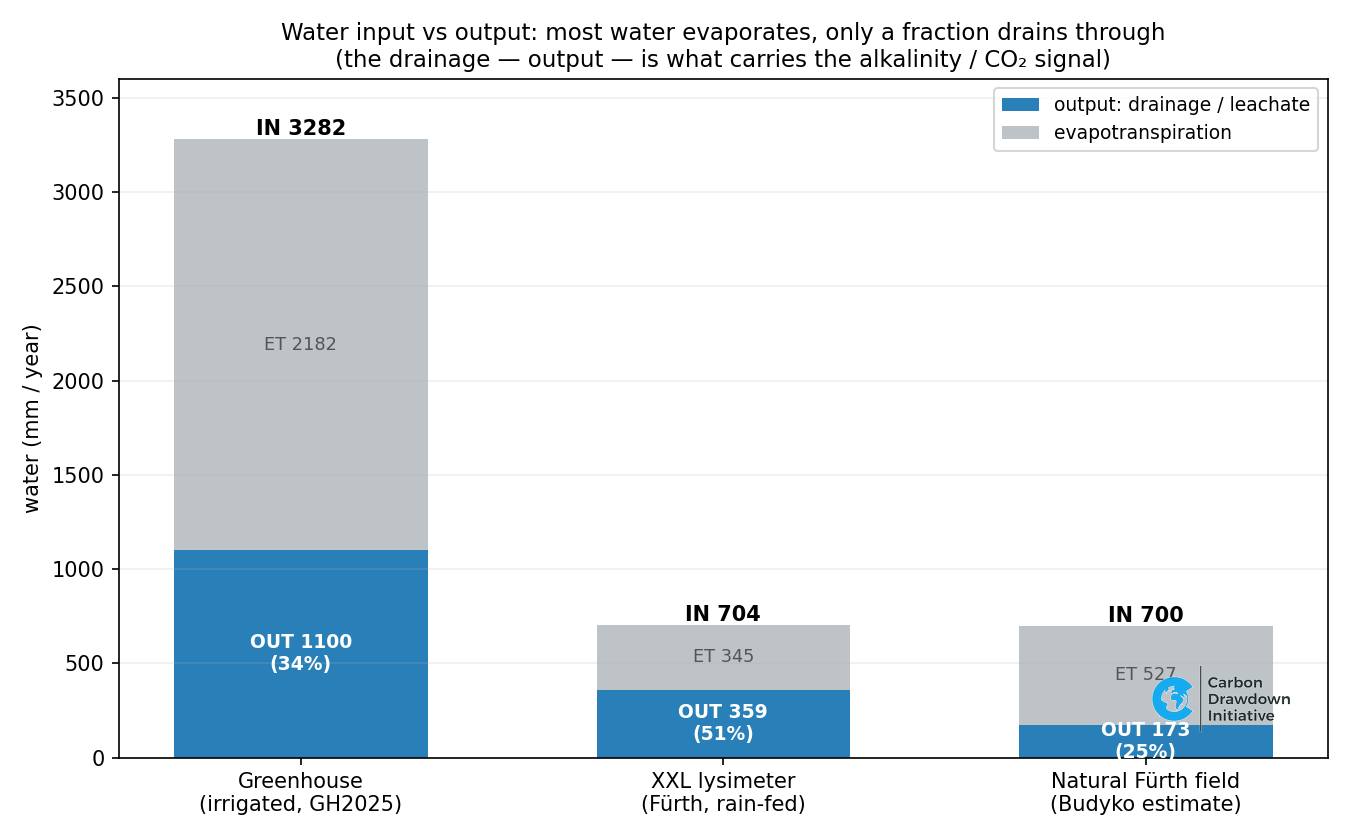
Averaged over three years and four sensor zones, our greenhouse runs at a mean of 22.5 °C with a ~10 °C summer-to-winter swing. The water is the striking part. We aimed for 2,000 mm of irrigation a year; the collection buckets show we actually applied ~3,300 mm, more in summer, to offset the intense evaporation and still leave enough water to sample. Of that, only about 1,100 mm actually drains through the pots; the other two thirds evaporate.
That last number is the important one. The alkalinity (the carbon-removal signal) leaves dissolved in the water that drains through the soil. So the number that matters for "where is this climate real" is not the 3,300 mm we pour in, nor the temperature alone, but the ~1,100 mm of drainage.
It has to be warm and actually drain ~1,100 mm
Match on temperature alone and you get a broad warm band, plus, absurdly, deserts (they have the steadiest temperatures on Earth). So we added the real constraint: a place must also naturally drain about 1,100 mm a year. Crucially, we do not match our inflated 3,300 mm of irrigation, our greenhouse over-evaporates because of warm pots (no cooling by ground) and small pot sizes. We match the drainage, and we estimate each location's natural drainage from climate (rainfall minus evaporation; see Methods).
The result is a much smaller, and much more honest, map. Look at the red stars, these are the closest twins to our greenhouse. The next 8 “almost best” matches are shown with orange markers.
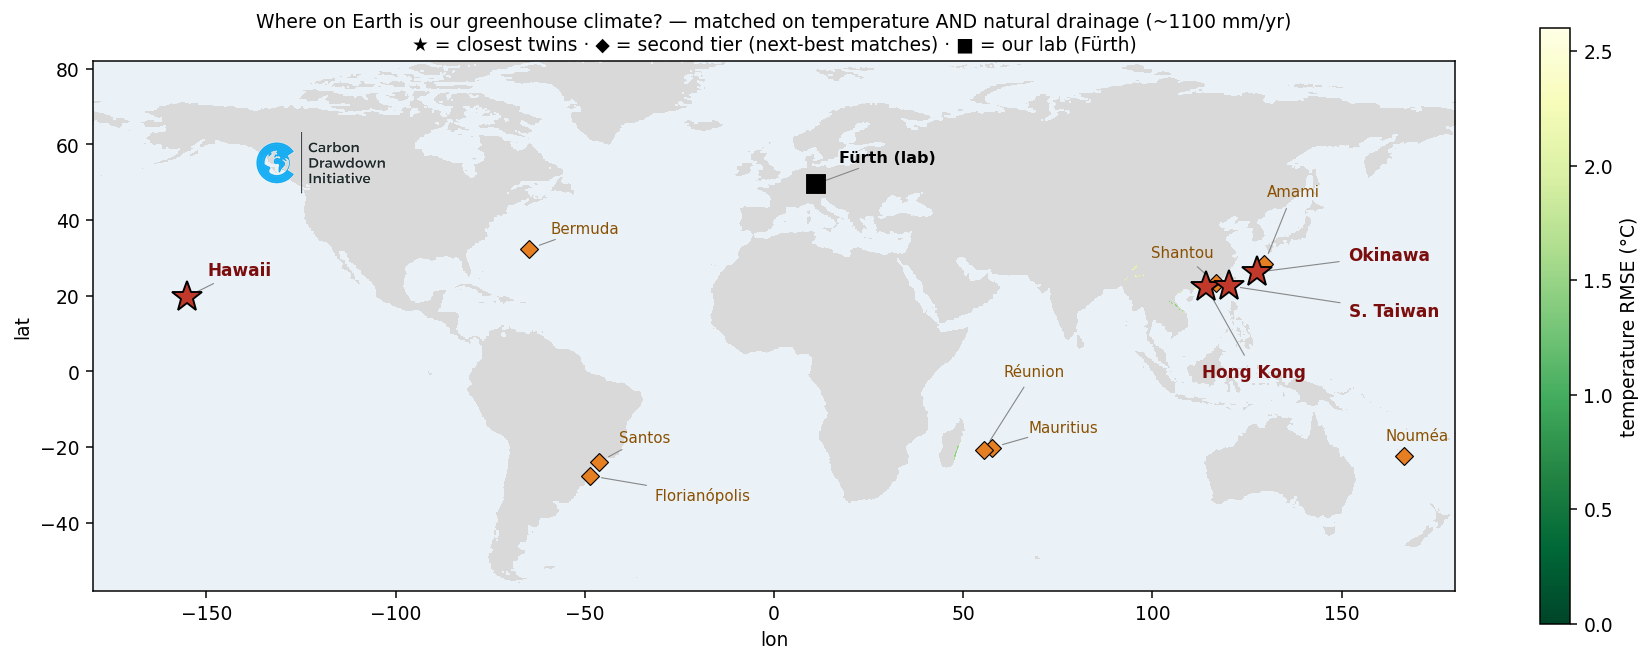
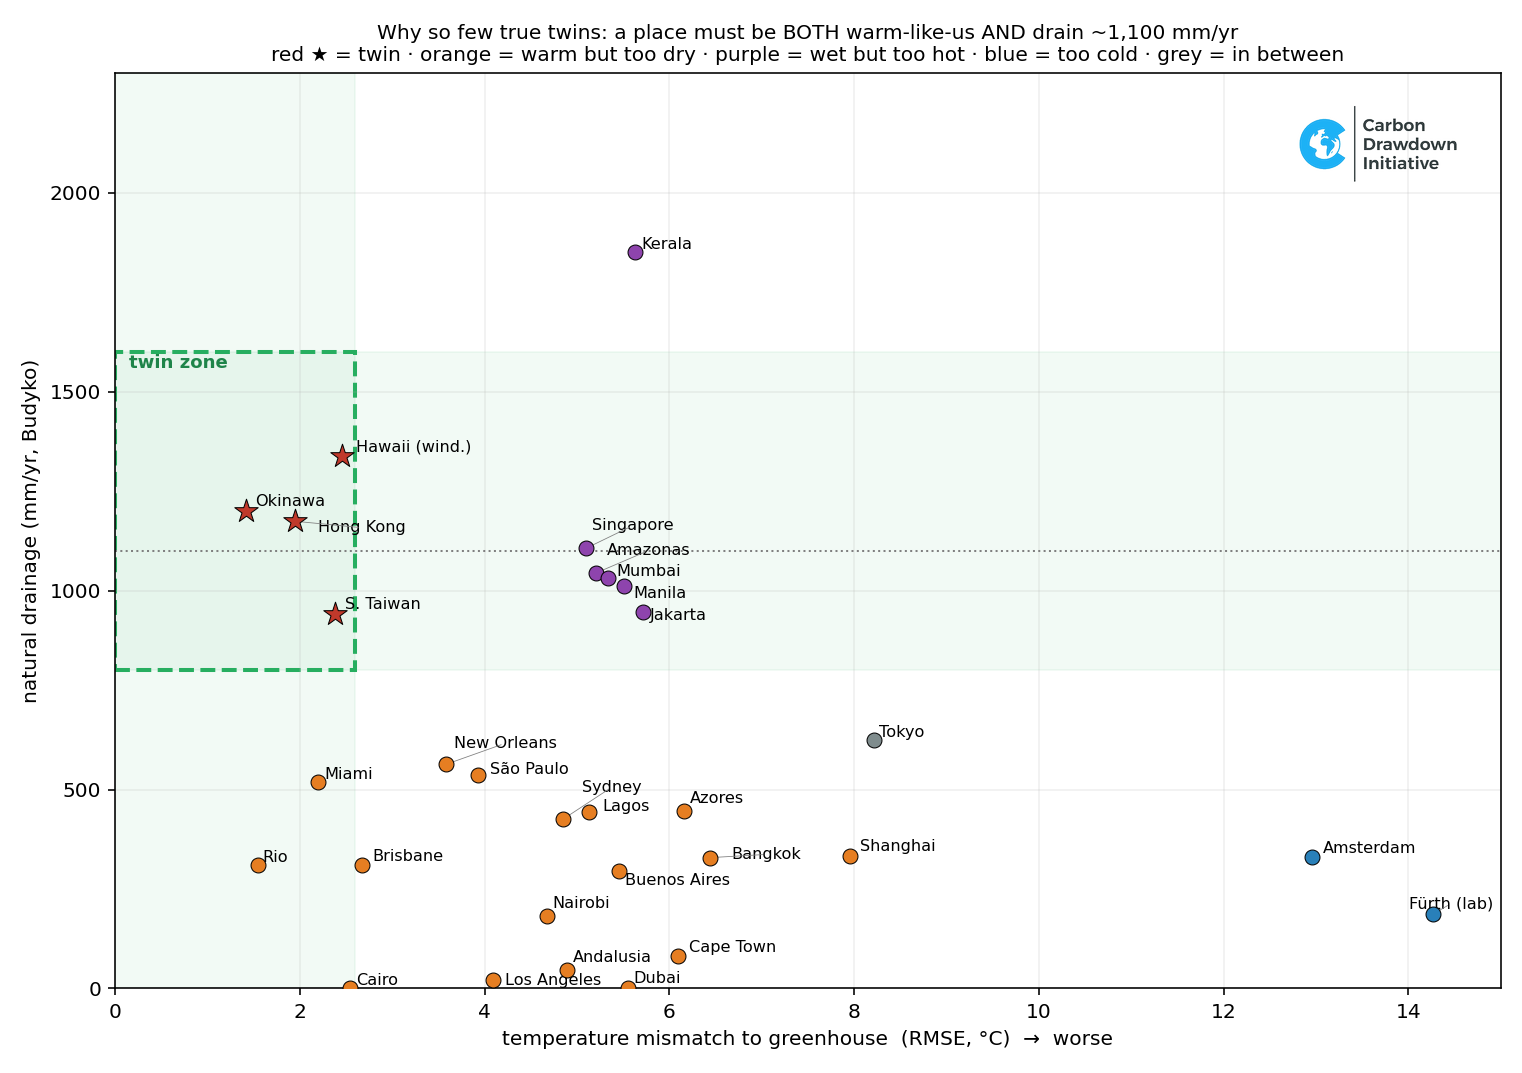
Only a narrow band qualifies on both axes (essentially the humid subtropical coasts and islands of East Asia).
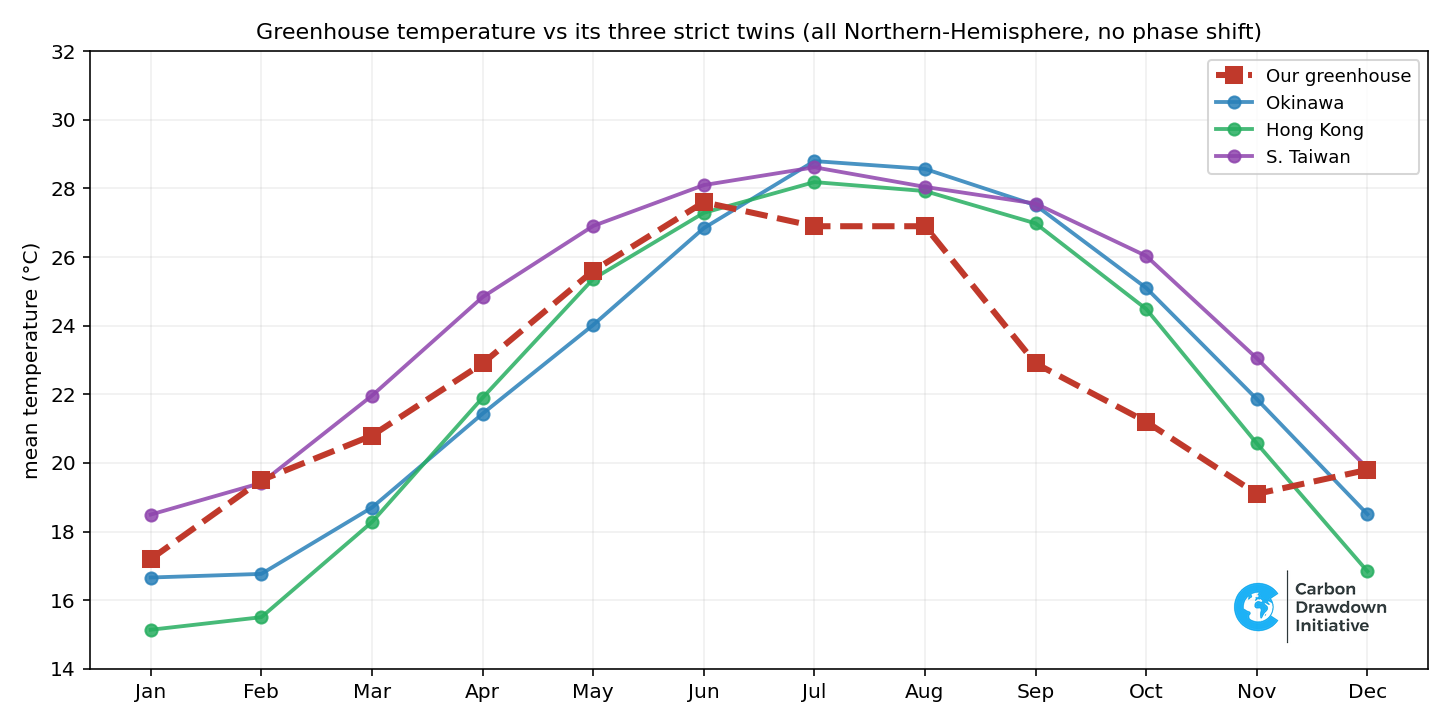
Okinawa, Japan: our closest twin of all: mean 22.9 °C, a matching ~12 °C seasonal swing, and ~1,200 mm of natural drainage. Almost literally our greenhouse, set outdoors.
Hong Kong: mean 22.4 °C, ~1,170 mm drainage.
Southern Taiwan (around Kaohsiung): a touch warmer, ~940 mm drainage.
One further match sits just outside East Asia, the windward side of Hawaii (warm and very wet, ~1,340 mm drainage), though its almost seasonless climate makes it a looser fit than the three above.
Could somewhere be even better?
A fair question: if warmth and water both help, why not the planet's rainiest, hottest places, Quibdó in Colombia (one of the wettest inhabited spots on Earth), Singapore, Monrovia, the Amazon? On paper they are: warm all year, no cold season, often wetter than us, so for uninterrupted weathering they sit even deeper in the favourable zone than our greenhouse does.
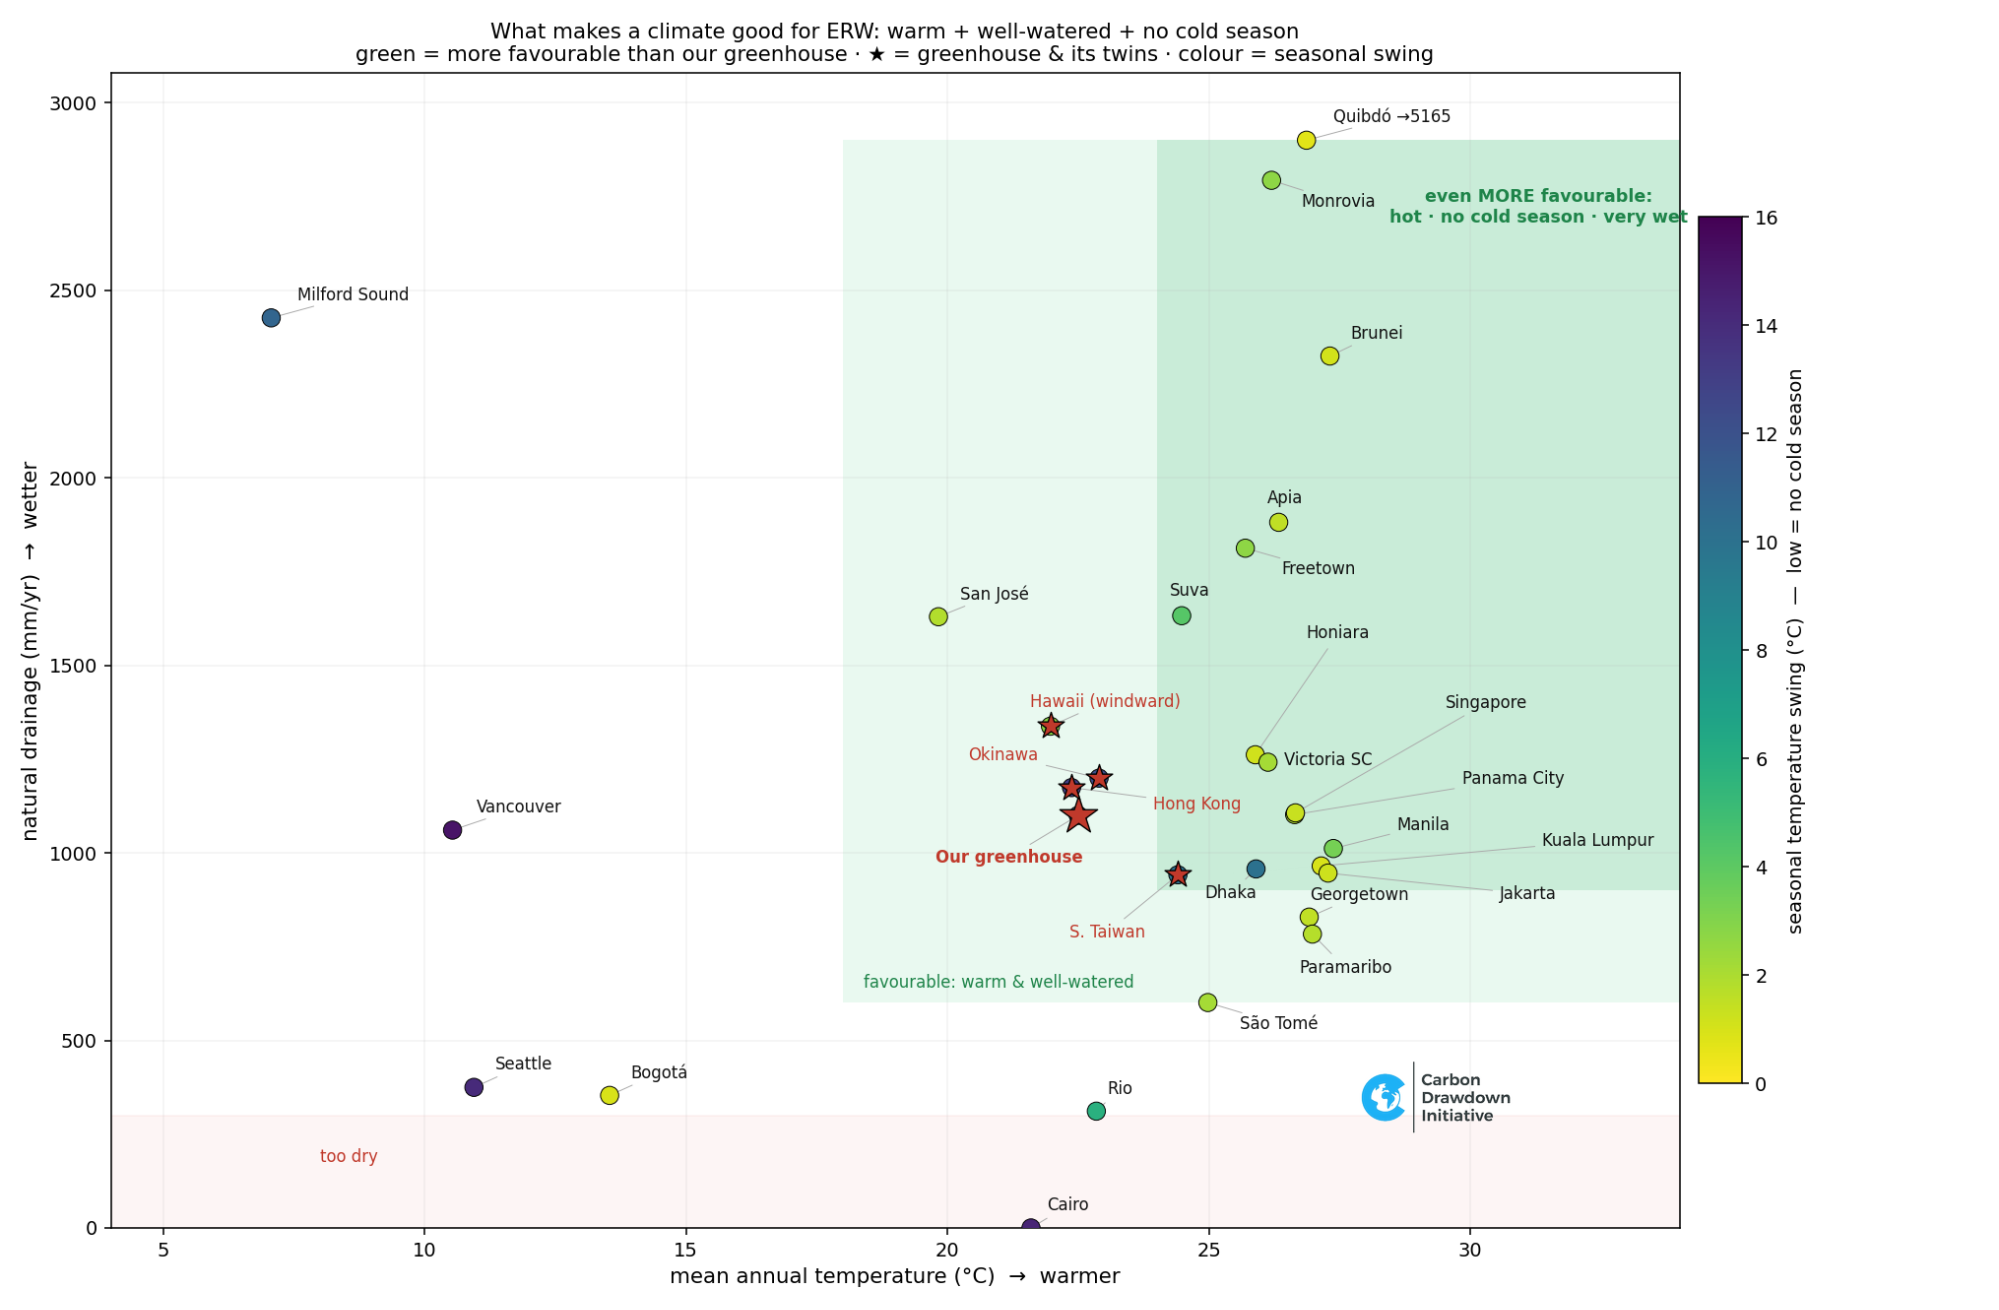
And our own back yard proves the point
A few kilometers from the greenhouse we run the XXL lysimeters: a selection of the same soils and rocks, outdoors, rain-fed, for four years. Cool, unremarkable Bavaria (Germany) drains only a few hundred mm a year (and it still removes real, measured CO₂, just slowly). (In fact our free-draining lysimeter drains ~360 mm/yr, about double what a natural Fürth field would recharge, a reminder that even our outdoor twin is on the generous side.) The lesson holds across the whole range: more drainage, faster removal, Okinawa fast, Rio slower, Bavaria slowest. Warmth is not the master dial; water is.
That is worth one honest admission. When we turned everything to "11" in 2023, the dial we trusted most was temperature: the textbook rule that weathering slows roughly ten-fold per 10 °C of cooling. Three experiments later, our own data say the carbon-relevant alkalinity barely moves with temperature between ~1.5 °C and 33 °C; temperature's real influence runs through the water (evaporation, and freezing). And the field literature quietly agrees: when Kantzas et al. (2022) ranked the UK for ERW, the deciding variable was the site water balance, and geochemists find natural weathering in the warm tropics "not temperature limited" (Edwards et al. 2017; Moore et al. 2024). The best-region maps point the same way, warm and wet (Strefler et al. 2018; Beerling et al. 2020; Baek et al. 2023).
For enhanced rock weathering: follow the water!
Methods. Greenhouse climate: daily air-temperature logs from four in-house sensor zones (2023–2026) give the monthly profile (mean 22.5 °C, amplitude ~10 °C). Irrigation: litres caught in the greenhouse's control collection buckets (empty buckets that only collect water), per table per ~4–6-week collection, converted to depth via the pot opening area (POT_AREA_M2 = 0.0415475 m², so 1 L ≈ 24.1 mm) and annualised per interval; time-weighted mean ≈ 3,300 mm/yr. Drainage (leachate): per-pot leachate volumes from the routine sampling workbooks, same conversion; ≈ 1,100 mm/yr. Global climate match: WorldClim 2.1 monthly normals at 10 arc-minutes (~18 km). Temperature similarity = the RMSE between our 12 monthly means and each land pixel's, minimised over a calendar shift so Southern-Hemisphere sites are compared season-for-season. Natural drainage everywhere: we do not match our (inflated) irrigation but each site's natural drainage, estimated with the standard Budyko water balance: potential evapotranspiration from the Hargreaves equation (WorldClim tmin/tmax/tavg + FAO-56 extraterrestrial radiation), actual evapotranspiration via the Budyko–Fu relation (ω = 2.6), drainage = precipitation − actual evapotranspiration. This is a spatially varying estimate, not a single global rainfall-to-drainage factor; it validates against known values (e.g. our Fürth site ≈ 173 mm/yr, matching the German national groundwater-recharge range of ~135–200 mm/yr). Ready-made global datasets (WaterGAP recharge, GRUN runoff, TerraClimate, GLEAM) give equivalent pictures if higher authority is wanted. Twin criterion: temperature RMSE < 2.6 °C and natural drainage between 800 and 1,600 mm/yr (bracketing our measured ~1,100). Data: the underlying experimental data are not public yet; WorldClim is public. All figures © Carbon Drawdown Initiative.