
Following the Carbon: Mapping Our CDR Portfolio Onto a Possible 2050
We now hold positions in more than 30 companies working across the carbon dioxide removal landscape — from direct air capture through enhanced rock weathering to ocean alkalinity. That's a lot of moving parts. We looked for a visualization of: where in the carbon streams are our portfolio companies active?
So we drew a picture. One Sankey diagram, four columns, every portfolio company placed on the actual pathway it works on (mainly). This article explains, where the numbers come from, what we learn from it, and — equally important — what is deliberately not in the picture.
How to read it
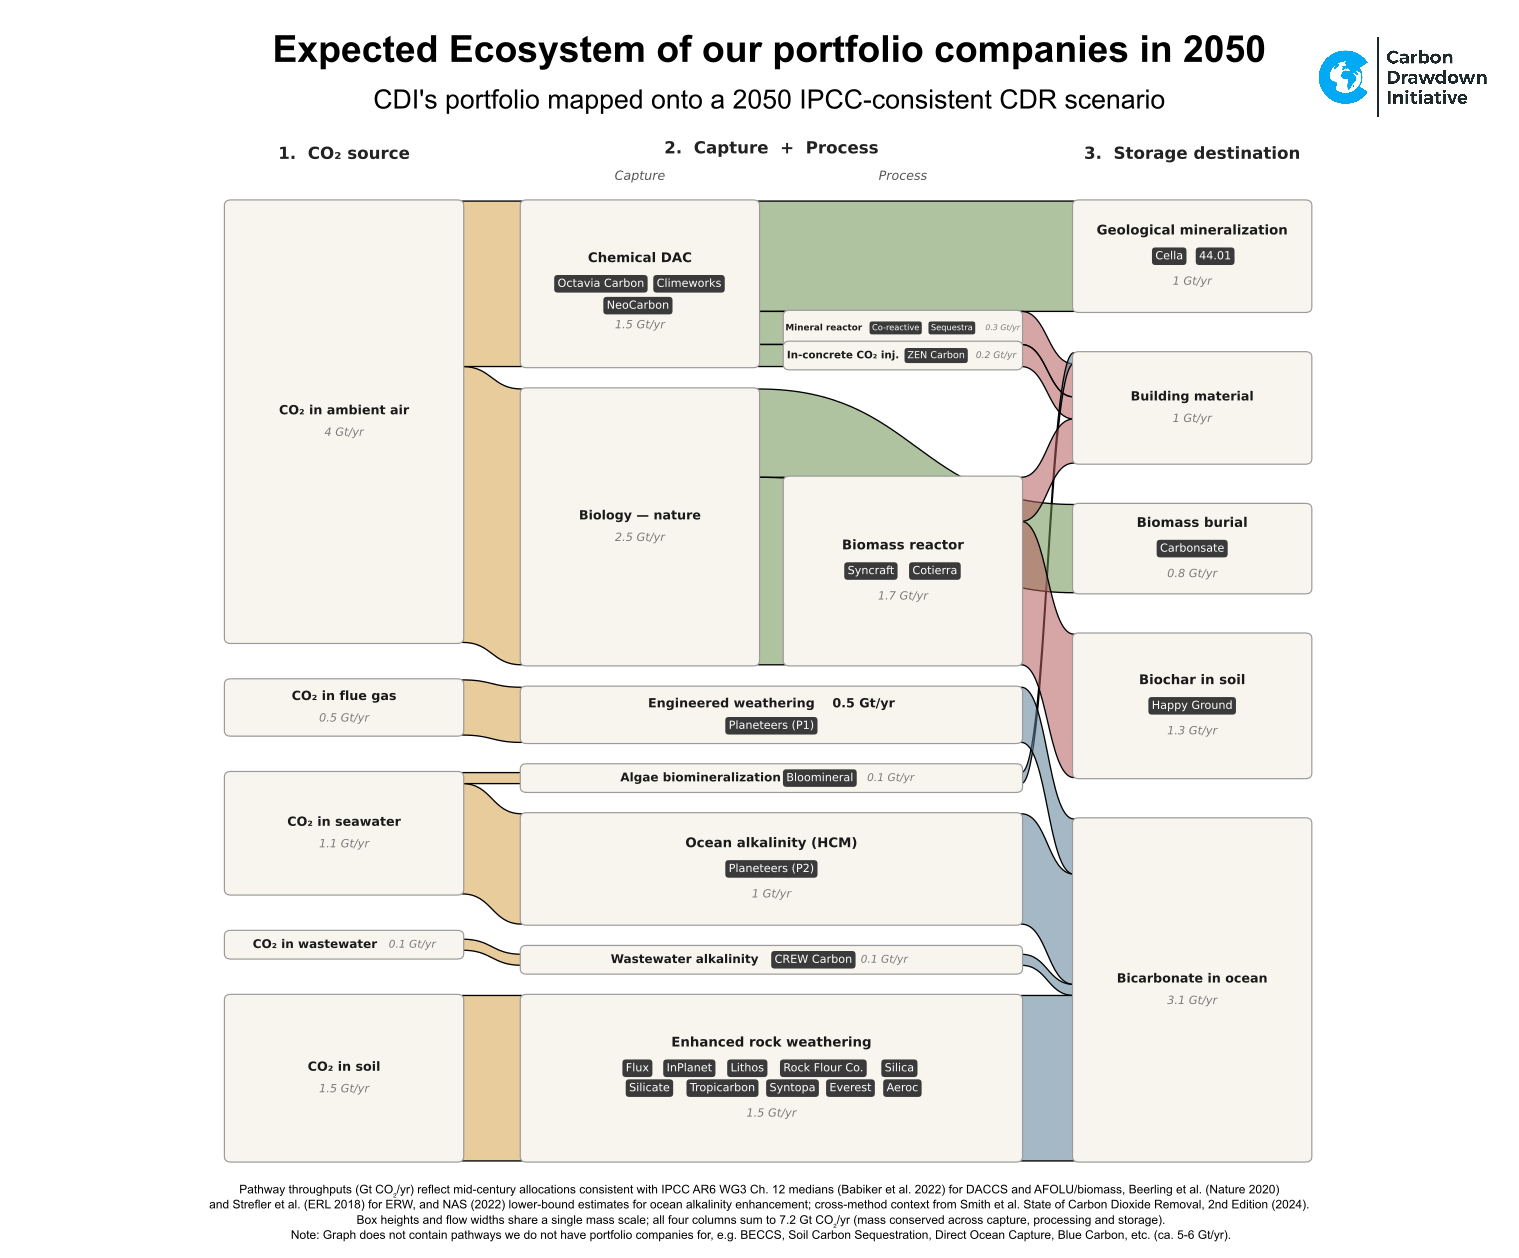
The diagram traces CO₂ from left to right through the four stages every removal method must pass through.
Column 1 — CO₂ source. Where the carbon is captured from: ambient air, flue gas, seawater, wastewater, or soil.
Column 2 — Capture. The technology that pulls it out: chemical DAC, biology.
Column 3 — Process. What happens to the C next: mineral reactor, in-concrete injection, biomass conversion.
Column 4 — Storage destination. Where the C ends up locked away: geological, building material, biochar in soil, biomass burial, or as bicarbonate dissolved in the ocean.
Some pathways skip an explicit process step — alkalinity-based ocean methods, for instance, capture and stabilize CO₂ in essentially one operation. Those are drawn as horizontal bars that span columns 2 and 3.
The most important property of the diagram is that box heights and ribbon widths share a single scale: vertical space equals gigatonnes of CO₂e per year (“CO₂ equivalents”, even the carbon has been transformed into something else already). That means columns 1, 2 and 4 each total the same height, because mass is conserved as carbon moves between stages. Bigger box = bigger pathway. Thicker ribbon = bigger flow. The visual weight is the real weight.
Each ribbon is colored by the stage it leaves: gold from the sources, sage from capture, terracotta from process boxes, slate from the direct spans. The portfolio companies are listed in dark pills inside their respective boxes — one pill per company, so you can see at a glance how many we have on each pathway.
Why we built this
The honest reason is that we needed to see the whole landscape at once. With 30+ investments built up over multiple years, it has become hard to hold the full picture in our heads — which methods are well-covered, where we have concentration, which adjacent pathways are missing entirely, where the carbon is supposed to go in the end.
A spreadsheet doesn't show you that. A Sankey does.
It also serves as a sanity check. If a pathway barely contributes to the total — ours or the world's — then at least we know what we're betting on. And if multiple companies sit on the same narrow pathway, the redundancy is visible.
Where the numbers come from
The 2050 throughputs in the diagram are not ours. They are compiled from:
IPCC AR6 WG3 Chapter 12 (Babiker et al. 2022) — for AFOLU/biomass and DACCS scenario medians
State of Carbon Dioxide Removal, 2nd Edition (Smith et al. 2024) — for cross-method context
Beerling et al. (Nature 2020) and Strefler et al. (ERL 2018) — for enhanced rock weathering
NAS (2022) — for ocean alkalinity ranges
We deliberately chose to display IPCC-consistent allocations rather than upper-bound technical potentials. The total comes to around 7 Gt CO₂/yr by mid-century, which is squarely in the range that current integrated assessment models actually deploy along 1.5 °C-aligned pathways. The maximum-potential view would be roughly twice as large, and we think it would mislead more than inform.
That said, the disclaimer matters: predictions are difficult, especially about the future. This diagram shows one possible 2050. It will not unfold exactly this way. Costs will surprise us, some methods will outperform their projections and others will quietly fail to scale, policy will tilt the playing field in directions nobody currently foresees. Treat the picture as a working hypothesis about magnitude, not a forecast.
BTW, the diagram would be looking totally different if we would use the carbon fluxes of today. It would be dominated by biochar, all other pathways are still tiny.
What we learn from it
Three things stand out when we look at our portfolio against this scaffold.
Coverage is solid. We hold positions across pathways that together account for roughly 7 Gt/yr of plausible 2050 contribution — which is to say, we are positioned across most of what is likely to matter at scale (except for the pathways we left out, see below). That outcome wasn't entirely deliberate; it emerged from years of individual investment decisions. Seeing the whole emerge as a coherent shape was reassuring.
Enhanced rock weathering is concentrated. Ten of our roughly thirty companies sit in ERW. By textbook portfolio theory this is clustering risk. We don't disagree — but it is also where our team has built the deepest in-house scientific bench. If you are going to overweight a pathway, overweight the one where you can actually distinguish good science from bad. We can.
The ocean is a much bigger long-term sink than most people intuit. Four of our pathways exit there: HCM ocean alkalinity, engineered weathering of flue gas, wastewater alkalinity, and the bulk of ERW (most of which leaves the cropland system as dissolved bicarbonate carried downstream, not as soil carbon). Together they account for the largest single storage box in the diagram, around 3 Gt/yr in the IPCC scenario. The ocean is the quiet workhorse of a great deal of what we do (71% of Earth’s surface is oceans).
Some of these boxes will disappear. That is also a kind of success.
This is the point I most want to emphasize.
Between now and 2050, some pathways shown in the diagram will fail. Some companies will hit fundamental scientific or economic walls. Some methods that look promising on paper will turn out, after honest measurement, not to deliver. That is not a problem with the field — it is the nature of frontier R&D.
The faster we learn that something does not work, the faster we can redirect capital, attention, and policy support into pathways that do. For an investor at this stage of CDR, "this didn't work" is not a failure mode; it is the most valuable form of information available. If a company we backed reaches a clear conclusion that their method has a fatal flaw — and they reach it early, with rigor, and they tell us — that conclusion alone is often worth the investment. Because it tells us, and the field, where to push harder elsewhere.
This is why we are comfortable holding more “niche” pathways like algae biomineralization, wastewater alkalinity, in-concrete injection — methods that will need to prove viable. The ones that do will be more credible for having been honestly tested. And the ones that don't will have given us, and the rest of the CDR community, the gift of a settled question.
What is missing, and why
Three larger pathways are conspicuously absent from the diagram: BECCS, large-scale afforestation/reforestation as a removal method, and blue carbon. Together those three account for a large slice of what most IAM scenarios assume by 2050. We hold no positions in any of them. A few words on why.
Forests as CDR. We do not believe in afforestation/reforestation as a permanent removal method at the gigatonne scale. Forests are wonderful — for biodiversity, for water cycles, for shade and soil and soul. But carbon stored in living biomass is not stored permanently in any meaningful climate sense. It is stored until the next fire, drought, beetle outbreak, or land-use reversal. A removal that comes back is not a removal. We invest in things that put carbon somewhere it cannot easily return from.
BECCS. I find it problematic. It is sized large in IAM scenarios — typically several gigatonnes per year by mid-century — but in my view this reflects a modeling convenience more than a real-world feasibility judgment. Integrated assessment models need a flexible negative-emissions backstop to balance their net-zero ledgers, and BECCS happens to be the option with the longest paper trail. Whether the actual land, water, and biomass logistics support deployment at the scale these models assume is a much harder question, and I am not yet convinced the answer is yes.
Blue carbon. Smaller potential, real co-benefits, but largely outside our investment thesis on permanence and verifiability.
These are personal views, and reasonable people disagree on all three. The diagram reflects what we actually invest in, not what models project.
What this graph looks like in 2026 estimates
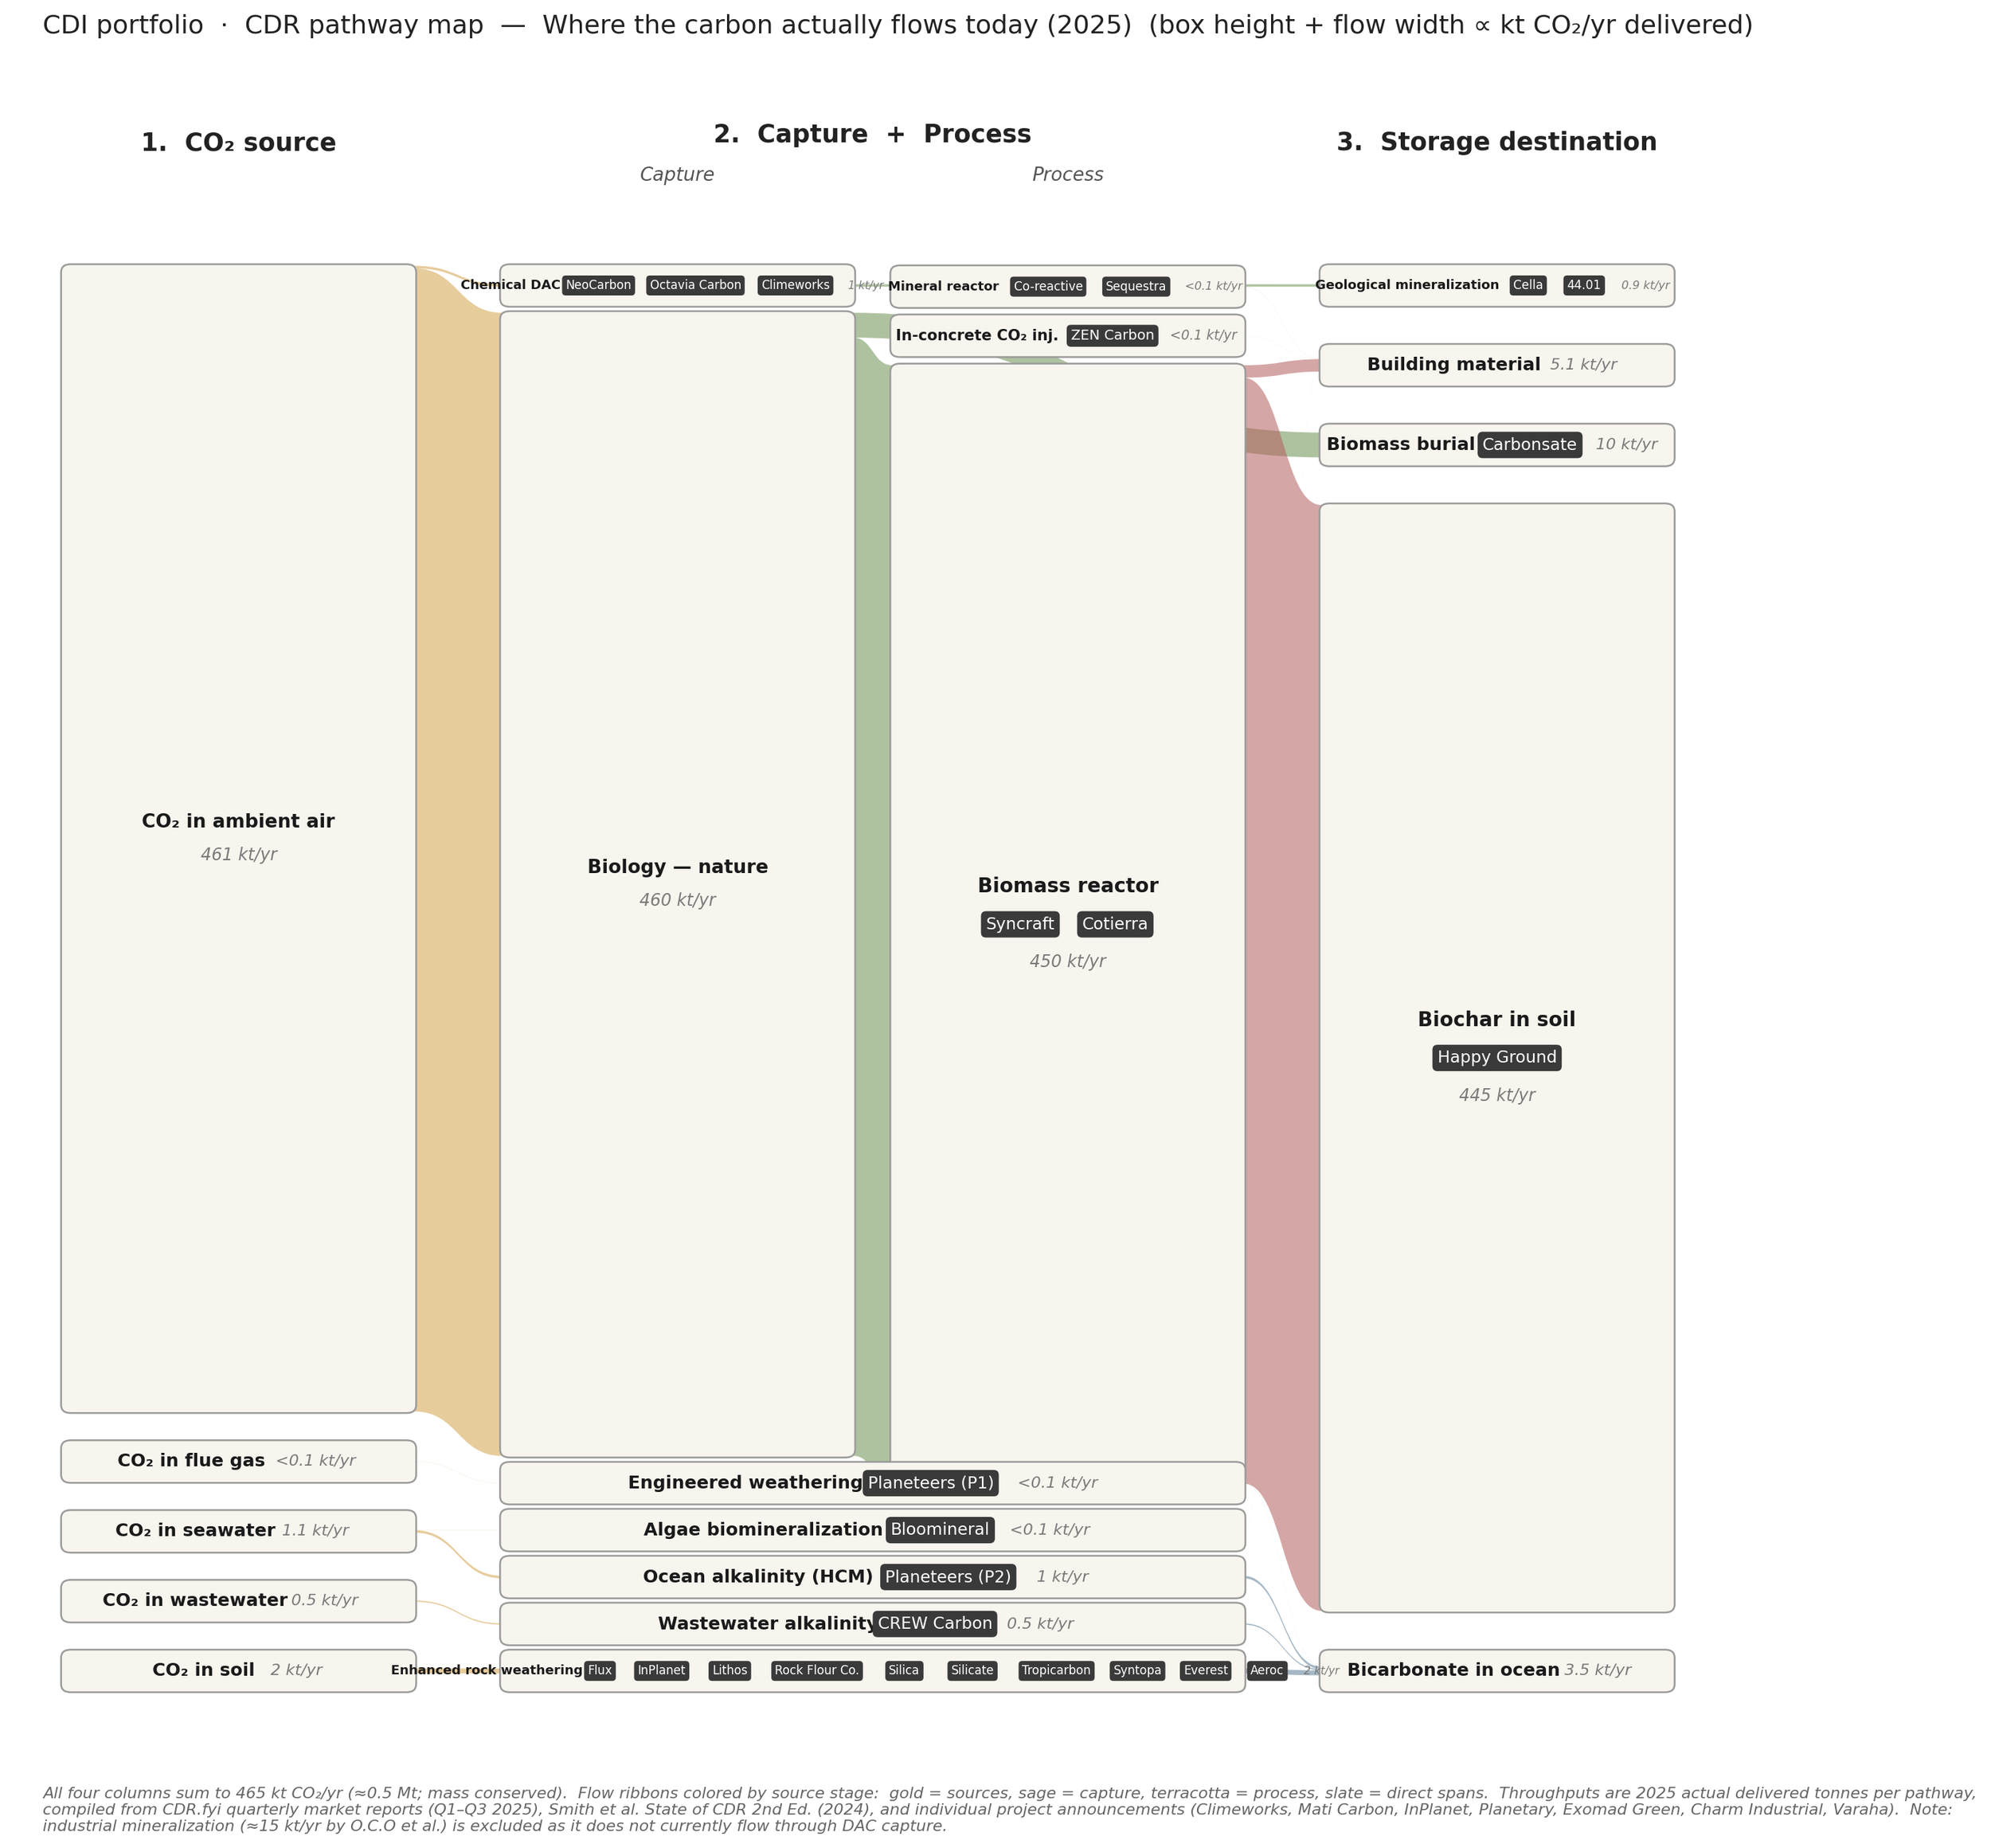
If we use the 2026 estimates for the carbon fluxes, the graph looks totally different. Most of the smaller blocks are not even small enough in this picture (but otherwise the labels wouldn’t fit anymore). The whole CDR market is simply dominated by biochar in 2026.
Again, please do not take the exact numbers of this chart for totally real, these are rough estimates and we have added this for visualization purposes only.
The CDR industry has a very long (and steep) way to go until 2050.