
How much faster is rock weathering in our greenhouse compared to the field?
by Dirk Paessler - 6.12.2023 - V0.3
The following is a thought experiment, a simplified approach to address this question. We are not even trying to do an exact calculation here, because it isn’t clear if we will ever be able to find an exact answer given the complexity of the ERW system with its multitude of processes and parameters. We just want to understand “where in the ballpark” the greenhouse’s increase of the weathering rate might be.
How do we “transfer” weathering rates measured in our greenhouse to the outside world?
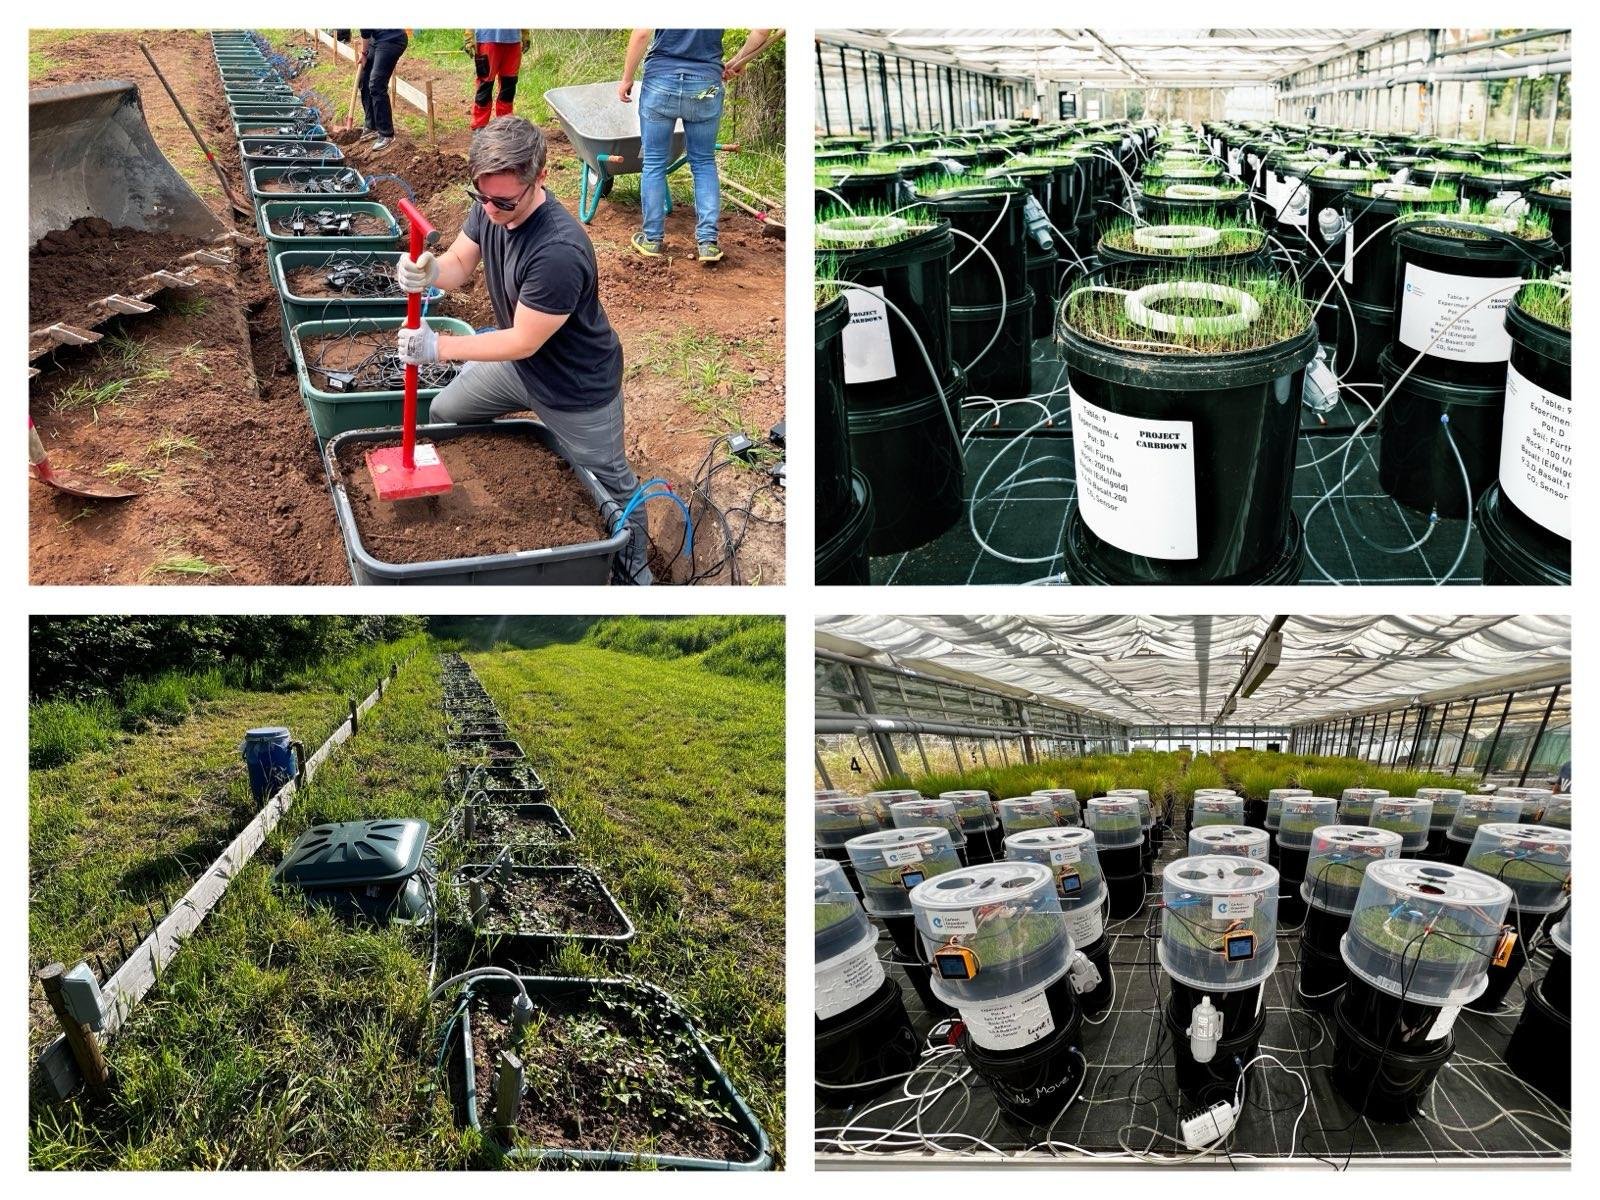
We wanted to get an understanding on how much faster the rock weathering in our greenhouse is compared to our outdoor XXL lysimeters in the Fürth field (near Nuremberg, Germany). In both experiments we have lysimeters with the same soils and rock amendments, but they differ by various environmental parameters, the main ones being temperature and moisture.
When we built our greenhouse in January 2023 we said that “we want to compress time”. Ideally by a factor of 2 or more. This should give us faster, stronger weathering signals that we can pick up with the various measurement approaches that we will apply. So we turned all the knobs to 11.
Now we are almost one year later and the differences between the two experimental environments are huge, the greenhouse (red lines) is constantly wetter and warmer than the outdoor setting (we used the annual averages to fill the greenhouse’s data gaps for Dec 2022/January 2023 to allow for a full 12 months comparison):

During summer we had two dry spells that drove the outdoor soil moisture to lows of around 10% sensor reading, which means practically dry earth - so likely no weathering happened at this time despite the high temperatures. During winter the outdoor soil temperatures are 15-20°C lower than in the greenhouse, close to zero - so weathering probably stops too, despite lots of moisture. (N.B. The experiment with the Fürth soil (table 9) had an irrigation problem for a few days at the end of May, that’s why there is this sharp dropping spike in the red line in the left graph.)
The basic reasoning behind the following calculations is that we would have had the fastest possible weathering rate if we had 365 days with 24 hours at 29°C soil temperature and 30% soil moisture, which are the maximum values we saw over the year. We assume that the weathering rates go down linearly to 0% weathering rate at 0°C (frost) and/or at 10% moisture (annual low).
Temperature Effects
In their paper "The Dissolution of Olivine Added to Soil at 4°C: Implications for Enhanced Weathering in Cold Regions" Pogge von Strandman et al. (2022) report: "However, after >100 days of reaction, the dissolution rate at 4°C was two orders of magnitude lower than at 19°C." They are “assuming a linear extrapolation between the dissolution rates at 4° and 19°C”.
The highest and lowest temperatures in our experiments are (using 5%/95% percentile to clean out outliers/measurement problems):

The greenhouse average annual temperature is double the outdoor average.
So we assume the perfect weathering rate of 100% is achieved at 29 °C, the greenhouse upper end of temperatures. And we assume only 1% of this weathering rate happens at 1 °C (low end of outdoor temperatures) with a linear interpolation between the two, following Pogge von Strandmann et al. The rate would be 0% for zero degrees or lower due to frost (which we did not have in the daily averages). With this approach we conservatively spread two orders of magnitude of weathering rate over a temperature band of 28 °C, twice the band that Strandmann had observed (4 °C to 19 °C).

When we calculate the weathering rate potential, i.e. the percentage of weathering rate that we could achieve depending on the temperature compared to an idealized temperature of 29 °C, we get the graph on the right.
The annual average for the outdoor setting is 37% while the greenhouse setting’s average is 77% (of the ideal always-at-29°C setting), almost twice as much which was to be expected when annual average temperatures are a factor 2 apart.
This would mean that in our greenhouse the annual weathering rate with regard to soil temperatures is about twice as high as in the outdoor setting, we would be stuffing 2 years into 1 year.
Moisture Effects
There is no weathering without H₂O, so the moisture rate plays a crucial role. The highest and lowest moisture rates in our experiments (both using the same soil “Fürth”) are:

In the greenhouse the average annual soil moisture was 27%, while in the field it was 20%.

If we, again, assume a linear relationship between moisture and weathering rate (0% weathering at 10% soil moisture, 100% weathering at 30% moisture), we get this graph on the right:
The annual average for the outdoor setting is 49% while the greenhouse setting’s average is 86% (of the ideal always-at-30% moisture situation). The greenhouse weathering rate is again almost twice as fast. This does not take into account the effects of wet/dry cycles which happen extensively in the field, but not in the greenhouse, where the irrigation cycle runs every 6 hours. Again, we would be stuffing about 2 years into 1 year.
Moisture and temperature effects combined

How can we combine both parameters? For the sake of this article we assume the two rates need to be multiplied (on a day-to-day level). This means that if the weathering is limited to 50% by moisture (i.e. 20% moisture) and limited to 50% by temperature (i.e. 15 °C) the resulting weathering rate is only 25% of the optimal rate at 29 °C and 30% moisture.
We get a weathering rate in the greenhouse (compared to 100% of a perfect setting) that over the whole year was about 4 times higher (65%) than in the outdoor setting (14%). This would mean we are “speeding up time” in the greenhouse by a factor of 4, we are stuffing 4 years into one.
Could soil gas CO₂ make a difference?

We have soil CO₂ data from the XXL lysimeters in the field and in the greenhouse between May and December. The all-time-averages in the greenhouse are in the range 3,200 ppm to 3,800 ppm, while the field based lysimeters show an average of 3,230 ppm (green line). Only in August/September there is a clear difference, the spike started when the June/July dry spell ended. So in essence, we would think that we cannot argue that the greenhouse is much faster/slower due to a difference in CO₂ levels in the soil.
What other parameters could play a role?
What we did not take into account yet was the seasonal changes of the light and with it the plant life. The light (daily daylight hours) and the local climate (clouds) are mostly the same for both the outdoor and greenhouse setting (experiments are 30 km away from each other), but the plant life in the soil pretty much shuts down twice in the outdoor setting, once during the droughts in summer and then also during winter, while in the greenhouse we have healthy plant life all year. This aspect will rather increase the speed-up factor to above 4 than lower it.

Another aspect is the water flow in the pots which is higher and more consistent in the greenhouse. Both experiments are using rain water (we use rainwater collected in a large cistern in the greenhouse). While the greenhouse pots were scheduled to receive the equivalent of 2,000 mm/year of rain in 4 irrigation events over every 24 hours, the field experiment only received around 681 mm/year of rain (which was already 13% more than usual). During the summer due to 80% evaporation loss we even had to increase the irrigation in the greenhouse to up to 6,000 mm/year for a few weeks to make sure that we would have leachate water for sampling every month. This has very likely made a considerable difference especially as it was also up to 29°C in the soil during that time and a lot of weathering products had to be washed away.
The irrigation not only affects the soil moisture (see above) but also the “flushing” of weathering products. The weathering rate slows down considerably when the ions from the chemical weathering reactions are not flushed away by water flow (i.e. the concentrations of ions are too high). It is likely that this effect slows down outdoor weathering, further increasing the multiplication factor between outdoor and greenhouse experiments.
Another difference between the greenhouse experiment and the outdoor installed XXL lysimeters is their soil fauna and flora. The open system environment with seasonal changes in climate for the XXL lysimeters is obviously a different ecosystem from the closed greenhouse pots at more stable temperature and moisture. However, the effect of biology on weathering rates is not yet fully understood. So for the sake of this argument we assume that the plants, bacteria and other biology (worms, etc.) are the same in both settings.
Summary
Taking all above parameters into account, we can conservatively assume at least a doubling of the weathering rate in the greenhouse compared to the outdoor setting with a good likelihood of approaching 3x or even 4x. So we reached our goal: Speeding up and enhancing the ERW signal so we could compare several measurement approaches in parallel faster than what would have been possible in any outdoor setting.
Digging much deeper into this topic will likely fill a whole PHD thesis, let us know at info@carbon-drawdown.de if you are interested in working with our data!