
Turn it to *11*! The greenhouse tactics that accelerate our ERW research
Our ambitious rock weathering climate experiment has been set up in a greenhouse equipped with hundreds of sensors which monitor the ambient climate as well as the experiments themselves. We took our experiments to the greenhouse because there we could accelerate our research compared to field work.
While we are preparing a first look at the weathering data we have also looked at how the ambient climate in the greenhouse has developed since January. Here comes an overview of this data and we explain the reasoning behind and the execution of our “turn it to 11” tactics.
Please note that there is also a photo diary of the things that happened.
To receive the next update of this story, please subscribe to our newsletter.
We have turned everything to 11-out-of-10

When we designed the experiment concept we decided that in the greenhouse we will turn every possible knob that might affect weathering to 11 on a scale of 0-10. We prioritized weathering performance and signal strength over being “closer to nature”.
It’s constantly warm, wet and we have 365 days of plant life per year. Also, the replicas (4 for each experiment) are much less heterogeneous than real life field settings (lots of blending and homogenization during setup). Our most used rock application rate is at the higher end of real-life amounts, 40 tons per hectare. Some experiments even have 100, 200 and 400 t/ha. A few experiments have only 20 t/ha so we can see the difference a smaller amount makes.
The idea behind this is to generate the fastest and largest possible weathering signal which we can pick up easier using various measurement methods that might be (or might not be) suitable to assess the rock weathering. There are a lot of unknowns in this field. The reason for this turn-to-11-approach was our experience: Our earlier experiments in the outside world did not come up with a notable weathering signal fast enough.
Of course, we are a somewhat away from the things that happen in a real world field, intentionally. Before we can go back to doing MRV in nature we wanted to produce valid ERW signals in the greenhouse. Taking this new knowledge back into “noisy” open nature will still remain hard enough, but at least we would then have a good idea what to look for.
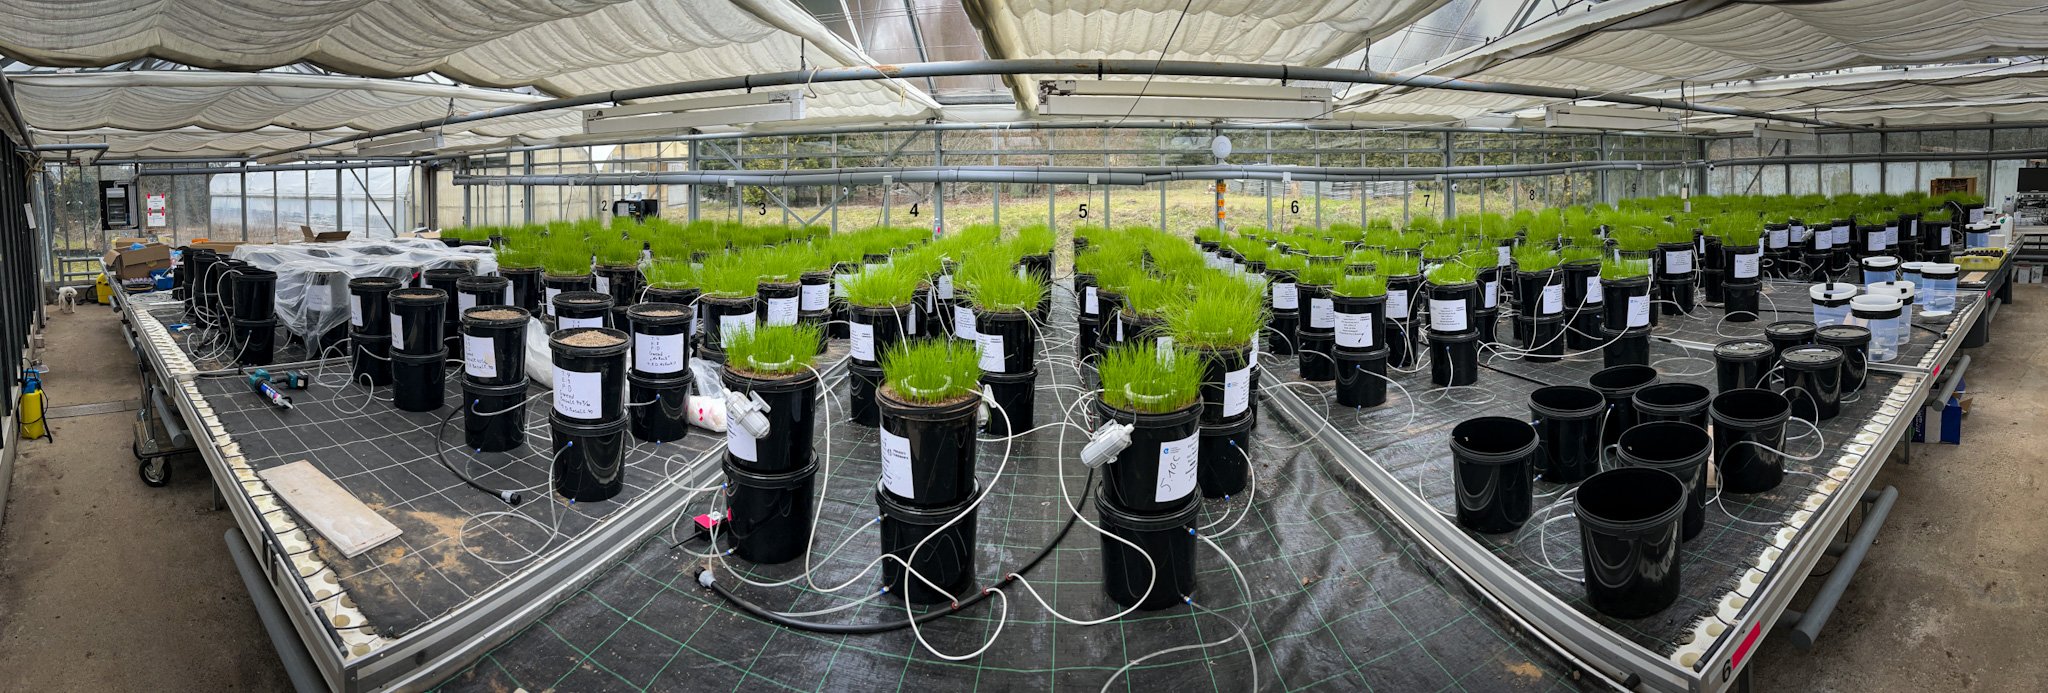
Greenhouse overview

Most of the experiments were built January 2023 in our Carbdown greenhouse near Fürth/Germany by a team of 25 scientists from 10 universities and climate/environment-oriented organizations.
The data presented below comes from hundreds of electronic sensors that we built into the greenhouse, that were built right into the experiments themselves or that are part of our fluxmeter army.
Our target irrigation rate is 2000 mm/year, but temporarily more was needed during the hot summer phases in June/July and late August to avoid the death of our plants (we saw evaporation rates beyond 80%) and to make sure we get a constant stream of leachate waters for analysis.
Perennial cover crop is grass (lolium perenne) which is cut about once per month. All the harvested biomass is preserved for analysis.
We are running up to 400 experiments (100 variants x 4 replicas) in self-built lysimeters (12 l of soil and soil/rock mix). The 100 variants cover 15 different soils including standardized soils from LUFA (2.1, 2.2 and 6S) plus 12 soils from real-life farms. These are mixed with 11 rock dusts with up to six different t/ha rates. Rocks include basalt, dunite, diabas, steel slag and actual real-world rock dusts from several rock weathering companies.
Ambient Temperatures
The soil temperature is an important aspect of weathering. Weathering rates go down by a factor of 10 for every 10°C less. This can have huge consequences and is one the reasons why weathering in the tropics should work much better than in temperate settings.
Target lowest soil temperature: 19 °C. We didn’t want to go any higher because our 30-years-old greenhouse is heated using evil fossil fuels. We had to seek a balance between the need for high temperatures and the undesired emissions we are causing with our experiment.
Target highest soil temperature: 30 °C. This is already warmer than most agricultural soils will ever be. During hot and sunny summer months we sometimes went above this value because we can not fully mitigate against high temperatures. We can close the shades and open the roof, but then our toolbox is empty (air conditioning is not an option, obviously).

The first graph shows the daily average ambient temperatures inside the greenhouse together with the outside temperatures. There is a construction-related temperature gradient inside the greenhouse from table 1 to table 9 of 0.5 °C to 1.5 °C, depending on outside weather.

Here are the daily minimum, average and maximum temperatures at table 3.

Soil Temperatures
When we look at the daily average soil temperatures for four of the our control experiments we can see that that the differences in ambient temperatures seen in the graph above are not present in the soil temperatures. The mass inside the pots buffers the delta and the experiments show almost no temperature differences. So this will unlikely affect our experiments.
The seasonal cycle is apparent. We had two heat waves this summer (early July and late August).

For three days (<1%) the average daily soil temperature was under 18 °C and for 8 days (<2%) it was over 30 °C. So we met our target temperature range for >97% of total time.
In retrospect for the months February 2023 to October 2023 we succeeded to stay inside our target temperature range almost all of the time. With the upcoming cold/dark months of November, December and January we will not likely see much of a change for the whole first year.

Ambient CO₂
The overall average CO₂ concentration in the greenhouse was 441 ppm (Feb-Oct) measured by CO₂ sensors sitting between our experiment pots. The graph shows the daily minimum, average and maximum CO₂ concentrations. Daily maximum values above 500 were caused by people working in greenhouse with roof closed.
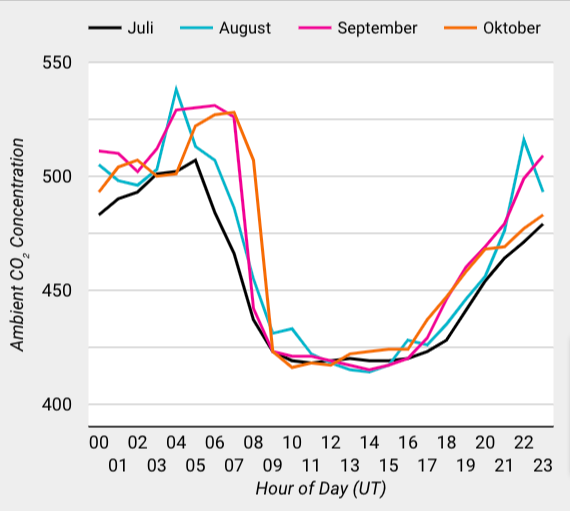
The next graph shows the daily change of the ambient CO₂ concentration measured inside the chambers of our fluxmeters (measured every 10 minutes). The times are in UT. We can see that between 9 and 11 o’clock (7:00-9:00 UT) the ambient CO₂ goes down from around 500 to 430 ppm. The way back is less pronounced in the afternoon/early evening.
We think this happens for two reasons, which happen both almost at the same time-of-day:
This is the summer data and sometime after sunrise it got too warm and the roof was opened by the ambience control system to keep the greenhouse from overheating. Fresh air comes in and lowers the ambient CO₂. In the evening the CO₂efflux from the experiments slowly takes over and pushed the ambient CO₂ back up to 500 ppm.
As soon as the sun stands high enough the plants receive enough light to start photosynthesis and to eat up ambient CO₂.

Humidity
As soon as the grass plants had developed in February/March we see an overall average humidity of 61%.

Soil Moisture
We are measuring the soil moisture using Dragino LSE01 wireless sensors which have an accuracy of 3-5%. The possible value ranges depend on the soil type (e.g. table 2, 8 and 9 have the same soil type), so one can’t compare the values between soils.
The absolute values may not be fully science proof, but the main point of this monitoring is to have an eye on our irrigation system. As you can see there was a problem on table 9 at the end of May, creating a downward spike, which could be fixed after a few days. A similar situation happened on table 2 in late August. Apart from that we successfully managed to keep the experiments constantly moist most of the time.

Light
The graph shows two luxmeter metrics:
Lux 2 is above the sun screen, the actual sunlight hitting the greenhouse’s roof
Lux 1 is the light intensity below the sun screen, the light that is hitting the experiments.
Between end of July and end of September we stopped the automatic opening of the sun screen to avoid overheating and kept it closed.
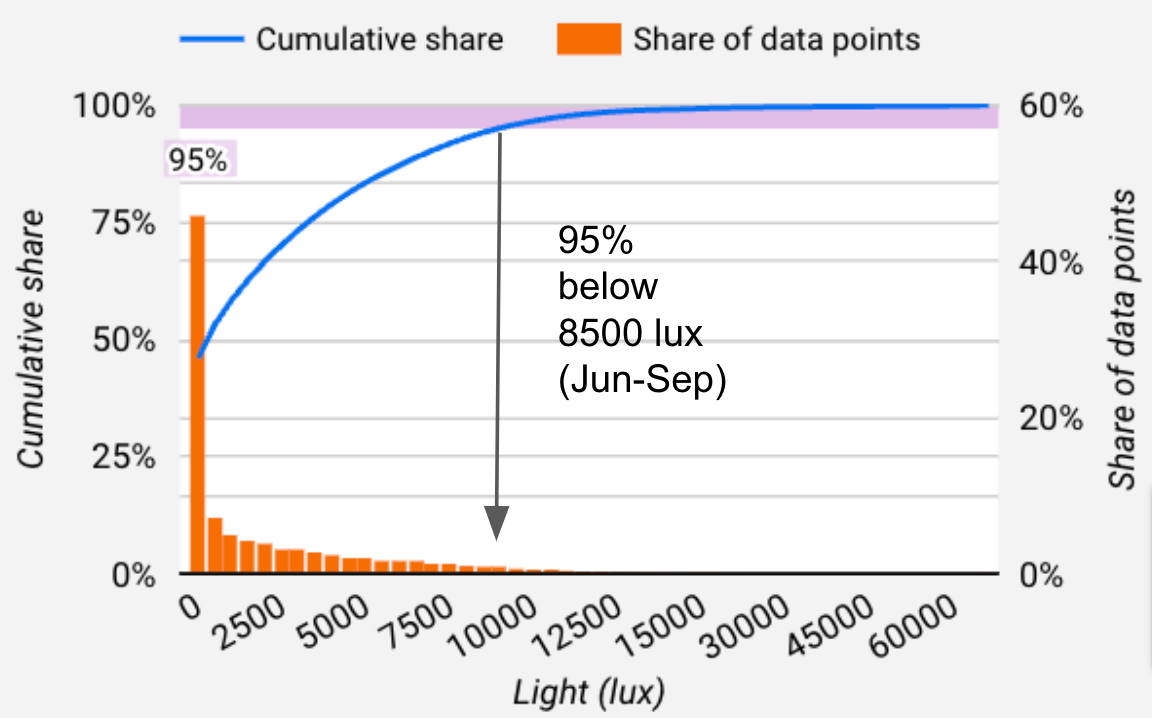
During the summer (July-September) the experiments received less than 8.500 lux 95% of the time. 45% of the time we measured a light intensity of 0 lux. With the upcoming darker months both these percentages will only increase for the full-year result.

Unsurprisingly light intensity, humidity and temperature have a strong relationship (data for summer, July-September 2023).

Irrigation Water volume
In total we used 22 m³ of cistern water between February and September. The graph shows the amounts of water which has been pumped onto each table. The values of one month are different per table because the number of experiments/lysimeters per table is different and also changes over time. The water volume per pot is actually controlled by the water sprinkler’s throughput multiplied with irrigation time.
In May and over the summer we had to increase/adapt the irrigation times in order to save our plants from dying. This was set back in August.

LeachAte Water volume
In total we got about 9 m³ of leachate water (ca. 60% of water evaporated). This graph shows the average cumulative amount of leachate water that was collected in the lysimeter tanks (per table/soil). This amount is highly dependent on the soil type, which also controls the evaporation rate. Most lysimeters have collected between 31 and 39 liters each between February and September. Table 4 (yellow), where some soils have high clay content, has had much less water throughput (22 liters), which indicates a higher evaporation rate, because all experiments have received the same water input. Table 2 (purple) was built in April and has seen less total volume yet.

Rain Water Cistern
We are also monitoring the water level in the rainwater cistern (rain water contains much less alkalinity than tap water which makes it much better for weathering experiments). During summer we barely have used 1/3 of the available water. A good summer rain at the end of July fully refilled the water tank.
To receive the next update of this story, please subscribe to our newsletter.