
Carbdown Greenhouse: How We Juggle Over 4 Million Data Points Daily in Real-Time. And Why.
Hundreds of sensors monitor the weathering processes of 400 climate experiments for enhanced rock weathering in the Project Carbdown greenhouse. Some send new data as often as every few seconds. This article explains why we use high frequency monitoring on a slow process and how we handle and analyze more than 4 million data points per day in real time using various cloud services while keeping cost below €150 per month.
Real-time monitoring meets weathering Data
Several unique aspects set the Carbdown greenhouse experiment apart:
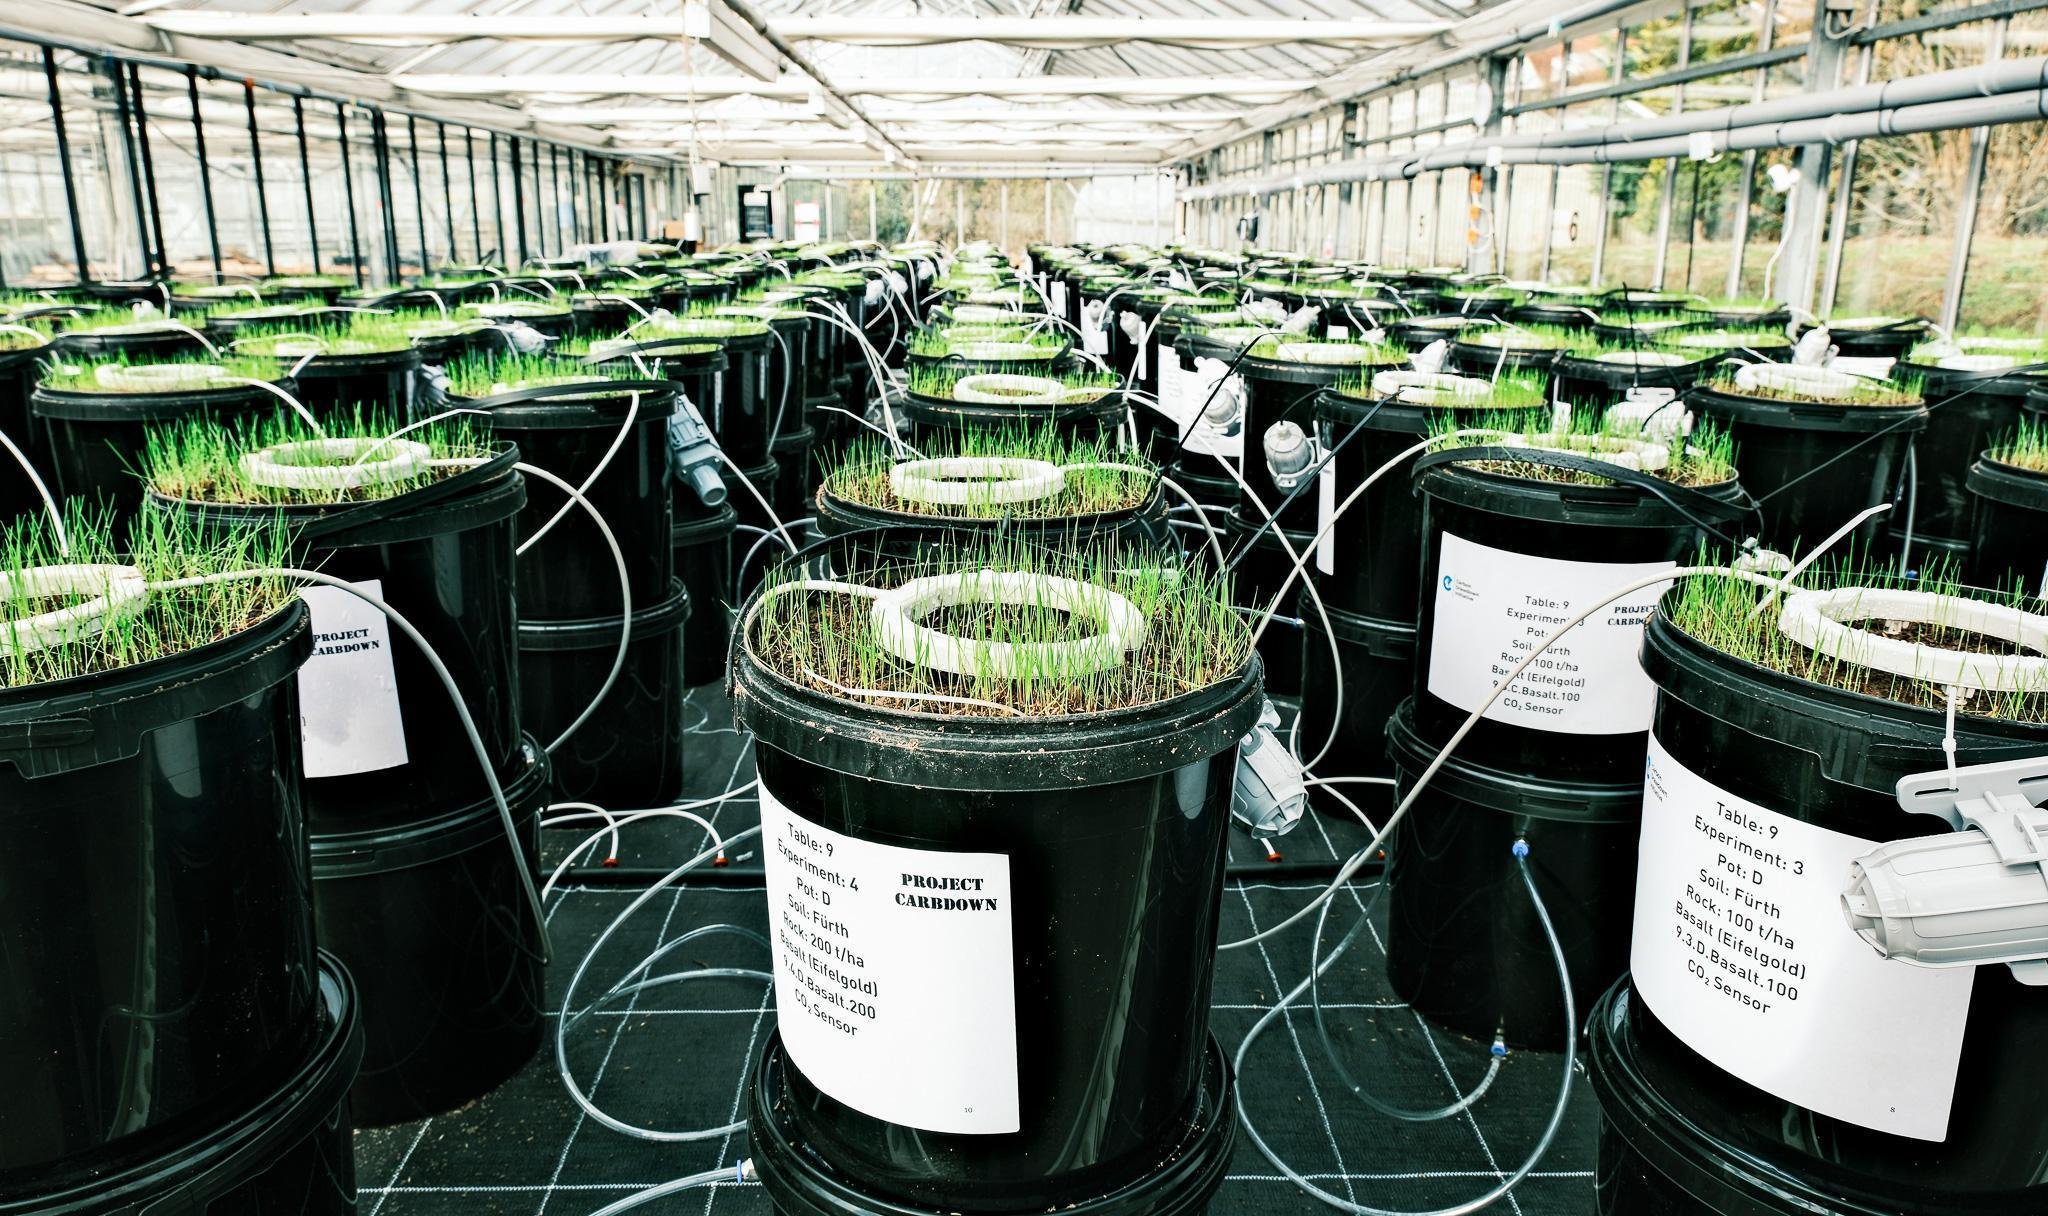
It is an extensive setup with 400 experiments (100 variations x 4 replicas).
We monitor hundreds of metrics using automated sensors and manual measurements at very short time intervals, all in real-time.
It is designed to run for 2-3 years and we try to speed up the weathering using multiple approaches.
At this scale it becomes effectively impossible to keep track of the incoming data manually. We needed to come up with a completely automated solution.
The order of Scale
We have built 400 lysimeters which contain combinations of 15 soils mixed with 11 rock dusts that we monitor with automated sensors and also manual sample processing. The monitoring happens at intervals of minutes to an hour, the sample processing happens at least once per month. On top of that we have added 50 autonomous fluxmeter robots that send data from their 5 sensors every 5 seconds.
In total more than 4 million data points per day are created by the greenhouse that need to be recorded, processed, visualized and analyzed. We do this by combining the on-site tech with various cloud services via a Starlink Internet connection.
Why high freQuency monitoring for a slow process like Weathering?
At first glance it may look like monitoring with minute or hour intervals is total overkill for such a slow process like rock weathering. The time scales for even small rates of the weathering itself are months or years. The challenge is that this rather slow signal is hidden in the abundant noise of a biotic party: nature throws a boisterous celebration in the soil.
There are a few weathering metrics that work fine on week or month interval scales, like metrics in the leachate water which accumulate over time. But these signals themselves are also very slow, too. Likely too slow to make enhanced weathering a successful solution to the climate crisis in time, we need to understand this faster. In Project Carbdown it is our explicitly stated goal to find more and especially faster signals of weathering.
High Frequency monitoring has potential, and problems
By harnessing the capabilities of high-frequency automated sensors, our objective is to discern our desired signal amidst the cacophony of biotic interactions. This refined methodology has the potential to offer insights into ERW metrics that traditional long-interval measurements might overlook.
It's worth noting that various soil signals exhibit marked diurnal, seasonal, or annual rhythms. External factors, such as precipitation events or prolonged dry spells, further modulate these intricate processes.
Examples for this problem

The first graph shows hourly measurements of the CO₂ concentration in soil gas of 3 experiments (median of 4 replicas) over a week for a control experiment and two rock amended experiments.
Because the daily curve pattern can be quite different from one day to the next it is impossible to pick up a difference signal between these experiments with just one or a few measurements per day. We would never know what part of the curve we have just measured. Even the time-of-day of the peaks changes all the time. Only a full day of data allows us to measure the actual differences between these experiments.

The second graph shows the hourly soil pH measurements from 12 experiments. We can see two “rhythms” in the graphs: The shorter, smaller spikes are caused by irrigation events (every 6 hours), the longer ones are intra-day developments, which are perturbated by climatic changes from one day to the next (more sun/less sun etc.).
Again, if you only take one or a few measurements per day you would not be able to come up with a proper daily average for the pH, because you would never hit the same point in the curve again.

The third graph shows the CO₂ concentration in the chamber of our fluxmeters while the chamber is opened and closed for 3 minutes (three times). Data points are shown every 10 seconds. From the rate of concentration change and the shape of the curve it is possible to calculate the CO₂ efflux from the soil. But this requires high frequency data.

The final graph shows such CO₂ efflux measurements for two experiments over 48 hours every 10 minutes im micromol/m²/s. The rate of change between two data points 10 minutes from each other can be fairly high, especially in the morning and in the evening. If you would take flux measurements only once per day or every few days, you would have no idea which part of the curve you have actually measured.
The theory: Nyquist-Shannon Sampling Theorem
According to the “Sampling Theorem”, to accurately reconstruct a continuous signal from its discrete samples, the signal must be sampled at a rate that is at least twice its highest frequency component. This rate is termed the Nyquist rate. If, hypothetically, the soil metrics can change every hour, then the highest frequency component is 1 change per hour. According to the Sampling Theorem, we would need to sample at least every 30 minutes to accurately capture this change. If changes can occur more frequently, then your sampling rate should be even higher.
To truly understand and capture the dynamic processes in the soil, especially those influenced by rapidly changing factors like weather events, a high-frequency monitoring regime is essential. By adhering to the principles of the Sampling Theorem, we can ensure that our monitoring system accurately represents the real-world dynamics of soil processes. And thus we might be able to use metrics for weathering science that have been unavailable in the past.
The data pipeline
Let’s look at how we move the data. Here is a visualization of the data pipeline that we have set up:

The greenhouse part
On the left in the greenhouse we have the 400 lysimeters. When we set up the experiment in January 2023 we had built LoRaWAN-sensors right into many of the pots. These monitor soil-gas-CO₂, soil-pH, soil-EC, soil-moisture and soil-temperature. Other LoRaWAN-sensors have been installed all over the place to monitor the ambient climate of the greenhouse including our cistern’s water level (have look at the ambient data).
Since June we have created and added 50 autonomous fluxmeters that we move to the next row of experiments every few days. They sit on top of the lysimeters and send data from their 5 sensors (pressure, humidity, CO₂, light, temperature) every 5 seconds using the greenhouse’s wifi network. Working with such short intervals is necessary to successfully measure fluxes at all, in fact internally the fluxmeters even work with millisecond timers.
Finally we have created a greenhouse controller that we use to send commands to the fluxmeter army and we have surveillance cameras. We use them as our automated logs books and they have helped numerous times to avoid a nightly ride to the greenhouse to check on things.
Transfer of data to the cloud

Like many agricultural projects our greenhouse is a little remote, does not have wired Internet and 5G is not great either. So we installed a Starlink dish to connect to the cloud. This works fine even beneath the glass roof (except when thick fresh snow accumulates on the roof until it is melted). Monthly cost: €60.
Most of the data from the greenhouse is transported to the cloud using the MQTT protocol which is a dedicated protocol for Internet-of-Things (IoT) applications. It is very lightweight and suitable for unstable connections. The central data juggling piece of the whole pipeline is the MQTT broker (Mosquitto). We have rented a monthly paid cloud service (€60/month) that also includes the Node Red service, which translates the incoming data and forwards it to the downstream services.
Storage of data
In the cloud we store three types of data:
Aggregated data: Most of the scientific analysis will be done on data that has been aggregated on-the-fly (every 10 minutes or 1 hour) from the incoming live data. This data is stored via Pipedream (€20/month) in Google Sheets and the analysis is done using Google Looker Studio (both services are free or part of a GSuite account).
Logging data: For maintenance and to enable us to dig into transient problems we run an event logging for all involved systems, also stored in Google Sheets. When we find a problem in the system we can roll back in this logbook to find out what the root cause was.
High frequency/live data: The complete data stream - which includes many data streams with 5 second interval - is being written into a time series database (Graphite). We then use Grafana dashboards to analyze the data (€30/month).
Alerting
Running a physical greenhouse and running such a data pipeline in the cloud can not be done successfully without monitoring and alerting. Things stumble or even break all the time. We have implemented various mechanisms that alert our team on their mobile phones should things run out of control. On top we are also using a fully-fledged IT monitoring system, PRTG Hosted Monitor (€129/month, ours is sponsored by Paessler, thank you!), that looks at the whole data pipeline constantly and helps to find/fix bottlenecks and outages.
Manual data entry
At least once every month we take leachate samples and harvest the biomass from every single lysimeter. Most samples are immediately analyzed on-site for pH, EC, TA and other metrics. Some samples are then sent to external labs, e.g. Analytik Institut Rietzler. When the data comes back it is (semi-)manually entered into the system so we can analyze it together with the automatically acquired data.
To receive the next update of this story, please subscribe to our newsletter.