
Quantification of ERW: Suggesting the concept of “stages” for MRV
To receive the next update of this story, please subscribe to our newsletter.
Concept paper - Aug 7th 2023 (updated Nov 24th) - Dirk Paessler - V0.6
Introduction
Welcome to the journey of “Project Carbdown,” our three-year mission to understand and measure the in-situ effects of enhanced rock weathering (ERW) as a means of Carbon Dioxide Removal (CDR). In an ideal world, we could measure every process along the way and verify the results. But reality is more complex, a little like assembling a puzzle with some pieces missing.
Drawing from our experience, we hereby propose the concept of “stages” to simplify the process. This concept is also used as “scopes” in the Greenhouse Gas Protocol standard to categorize greenhouse gas emissions. We'll apply this same idea to ERW.
Note: This explanation is intentionally simplified to make a complex process more accessible.
MRV Approaches for ERW
When discussing "MRV" (Monitoring, Reporting, Verification) for rock weathering, misunderstandings often arise because people refer to different "stages" related to measurement and calculation. Imagine trying to compare apples and oranges; buyers and sellers may have different expectations about what's being measured and how (and also what time scales are involved).
Why does this confusion happen? It's because measuring climate effects becomes more challenging the further we move away from the actual spreading of rock, which is the simplest part. Think of it as trying to trace a river's path from its mouth to its source; the journey of the dissolved rock dust gets longer and more complex as we go from field to ocean over months or even decades.
Unlike simpler carbon dioxide removal methods, ERW's complexity makes it nearly impossible to measure every detail across the full capture and storage process. As we intend to spread rock over huge areas in the future, we will have to rely on models and assumptions, using safety buffers to cover uncertainties. But to enable these models we need quantifications at a smaller scale first.
The ways to quantify these effects vary, including measuring tons of spread rock, dissolution rates of minerals, or even total alkalinity in leachates. It's a multifaceted process, like using different tools to build a complex structure.
Short Version (if you are in hurry)
The 4 stages for MRV of ERW
In a few sentences the concept looks like this:
Stage 1: Rock Production and Transport (The Starting Line)
Think of this as the preparation stage. We measure the emissions related to the production, transport and spreading of rock, which is fairly straightforward.Stage 2: Carbon Capture (The Reaction Stage)
Here, the rock reacts with carbonic acid, capturing carbon over years or even decades. We can track this through metrics like the rock dissolution rate. This stage is more challenging, like laying the first few rows of bricks.Stage 3: Complex Soil Processes (The Mystery Stage)
This part involves a series of complex soil interactions after rock dust addition. Measuring the increase in cations and alkalinity in leachate waters or the amount of released cations parking at exchange sites or the different carbon pools and fluxes is common here. However, a mixture of chemical, physical and biological soil processes may interact with the dissolved base cations and alkalinity, making this stage perplexing like a twist in a mystery novel.Stage 4: Transport and Storage (The Final Destination)
This stage accounts for the losses and delays in transporting and storing carbon in soils, rivers and oceans. Some alkalinity may also remain in groundwater, becoming permanent carbon storage, too. This stage is hardest to measure, like dropping some red dye in a river and looking for it a few kilometers downstream.
Long Version (with a nice graphic)
The 4 stages for MRV of ERW
In the following graph we have tried to come up with a thinking-concept of the main drivers and issues of enhanced rock weathering and to sort them into four stages. The first two stages cover the capture of the carbon (blue) while the last two stages cover the storage of the carbon (green):
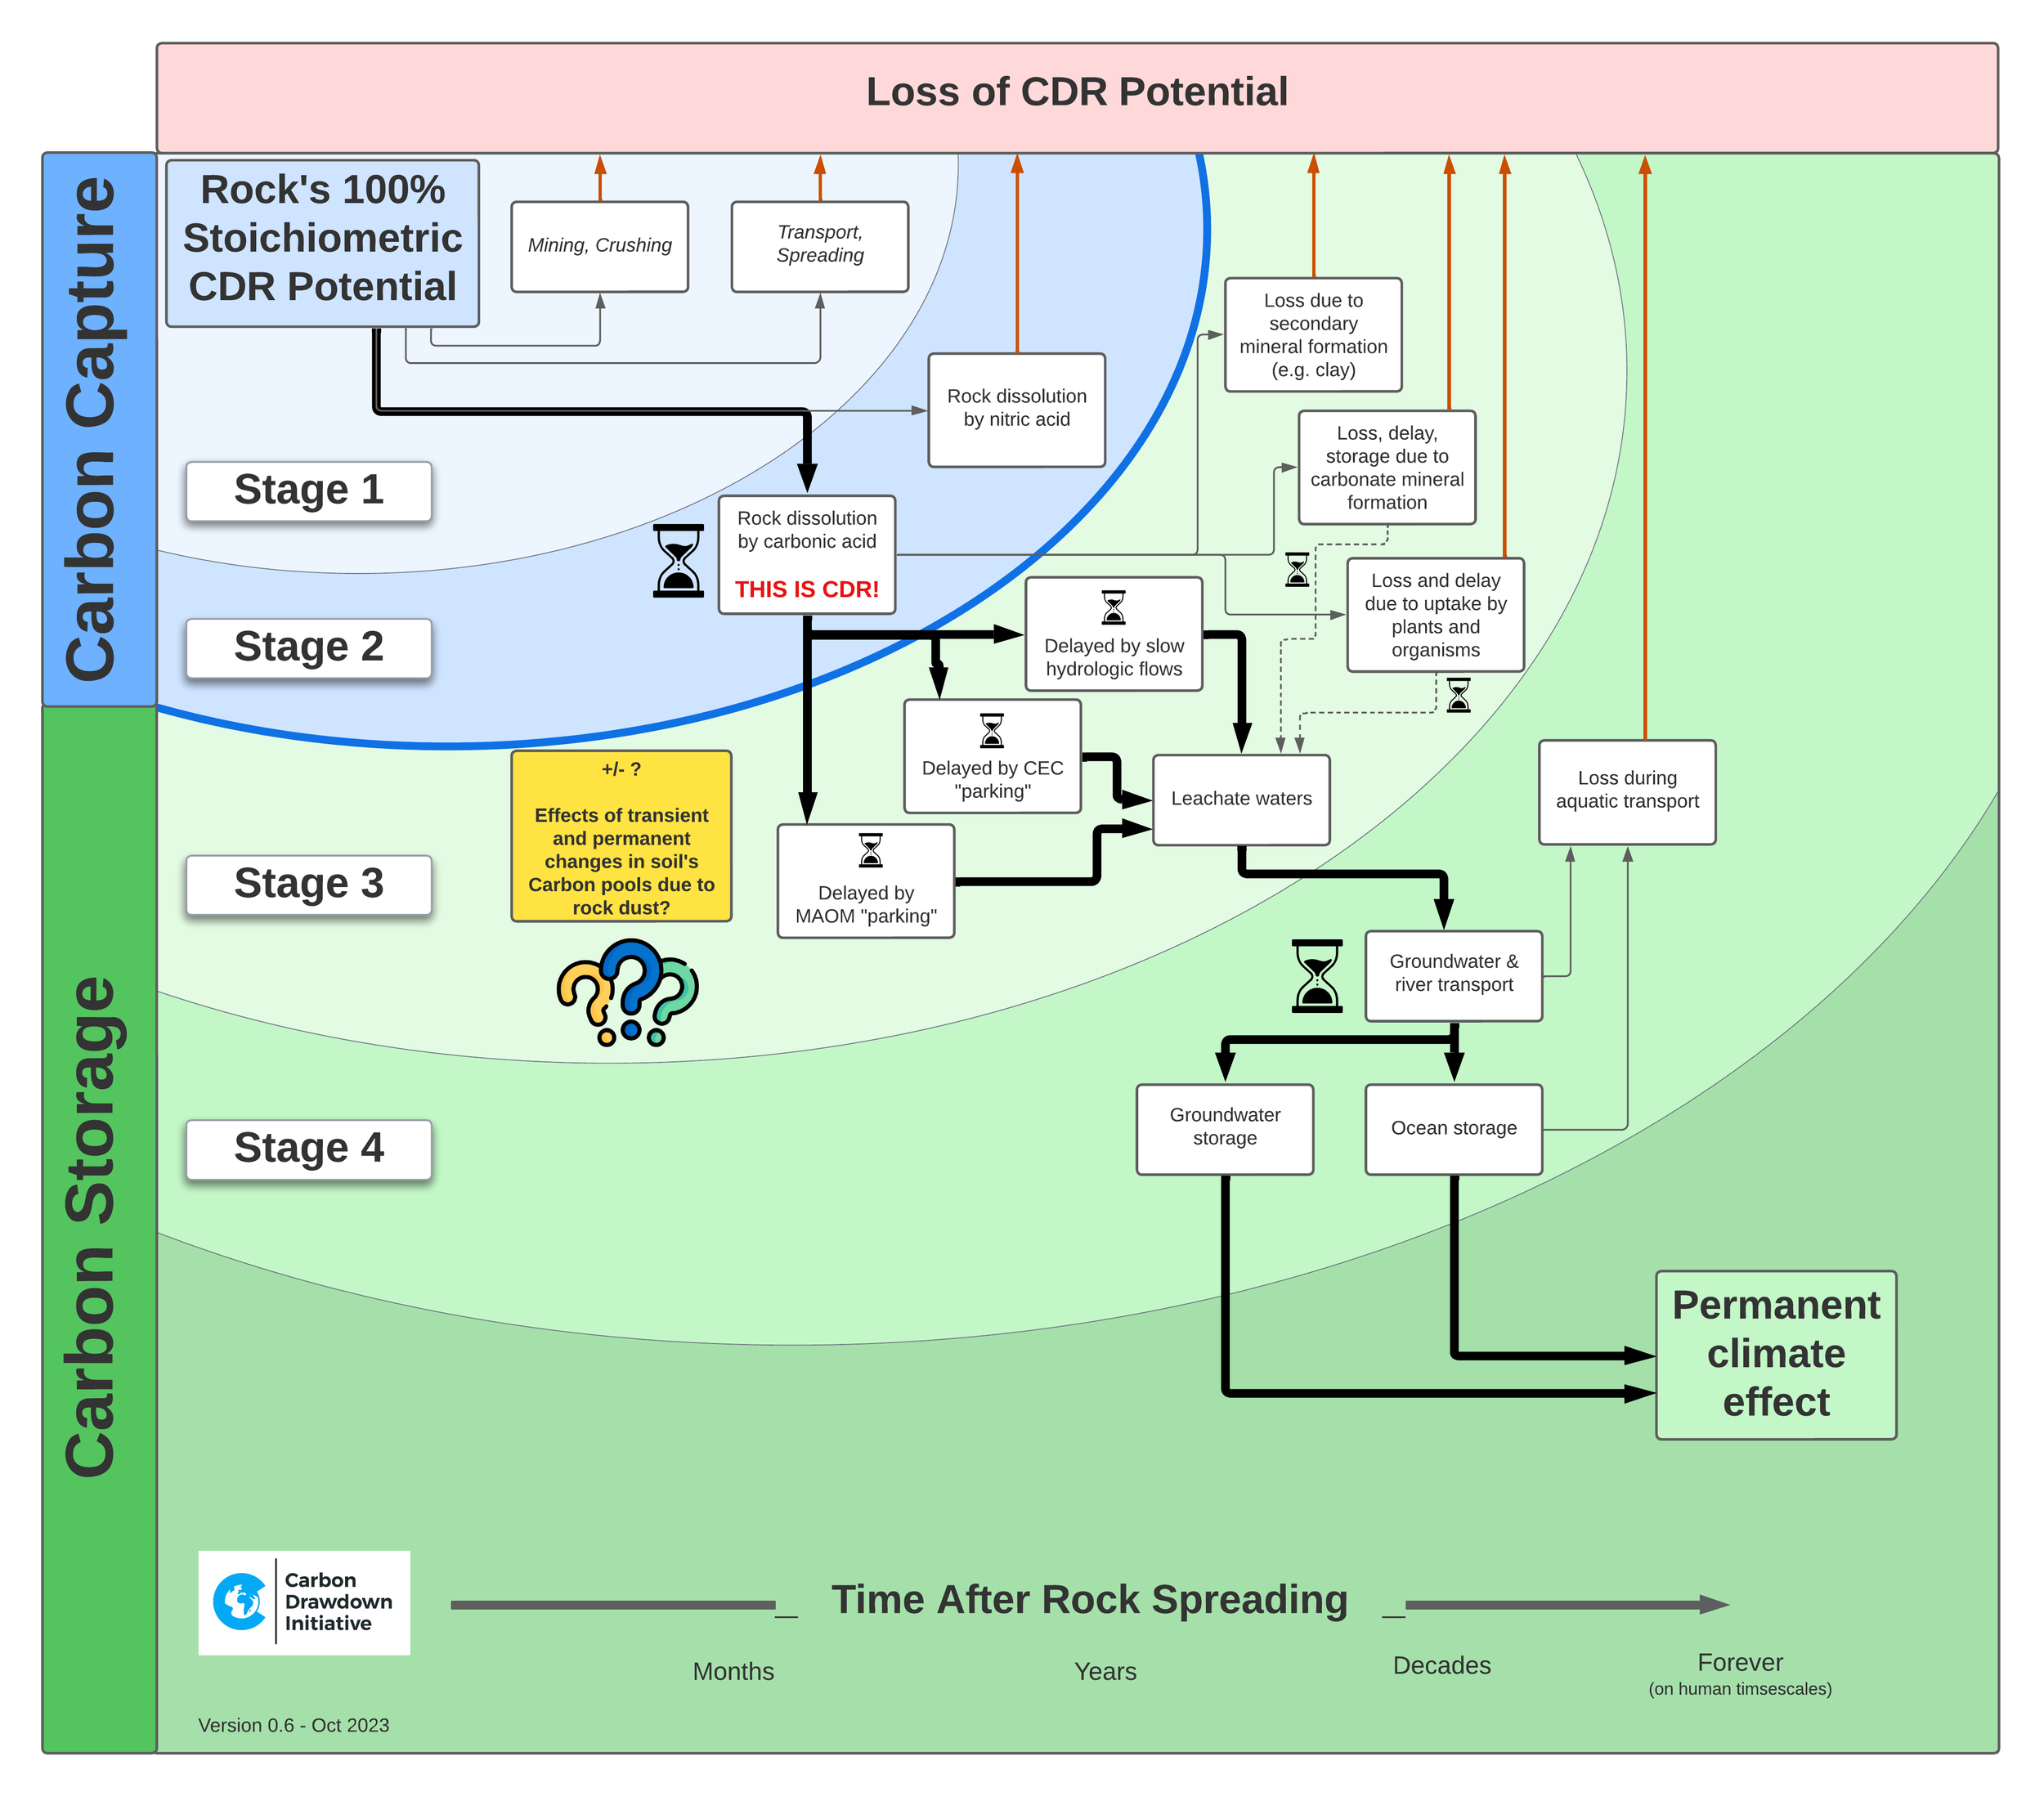
The graph illustrates the carbon dioxide removal effect (CDR effect) of the rock. Think of it as the rock's ability to capture carbon, initially calculated through its chemical makeup. It's like starting a race at full speed (100%) and then encountering obstacles that slow you down as you move downstream until you reach the final climate effect at the finish line.
Here's how the four stages unfold, from the top to the bottom of the process, with time flowing from left (getting and spreading the rock) to right (the remaining rock's elements and captured carbon reaching the ocean):
Stage 1: This is where we measure the emissions from making and spreading the rock, as well as the amount spread. It's straightforward, like measuring the ingredients for a recipe.
Stage 2: Here, the real action of carbon capture takes place. The rock reacts with carbonic acid, forming bicarbonate and trapping carbon. This process can take years or even decades to complete. Although measuring the rock's dissolution rate to track progress is more challenging than measuring the spread rock, it's still an accessible way to gauge the effect. This stage defines the rock's ability to remove carbon from the atmosphere, though some of that ability may be reduced in later stages.
Stage 3: This complex stage involves various soil processes after adding rock dust. Measuring the increase in base cations and alkalinity in the water that filters through the soil is a common method here. However, some of these CDR products might be temporarily hidden, like treasures buried in the soil, upon interaction with existing soil components. In case of the formation of new minerals like clay they are even permanently lost. Furthermore, possible interactions of rock with soil life remain a fascinating mystery for now. For example, microbes might increase CO₂ production, like over-fertilized plants, or stabilize organic matter, providing long-term carbon storage.
A short detour regarding the soil’s Carbon pools and rock dust: In our greenhouse, some intriguing phenomena are unfolding. After adding rock to the soil, several experiments have shown an initial increase in CO₂ emissions (first months). Others have also observed this behavior (e.g. Vienne et al. (2023, preprint), Yan et al. (2023). We have talked to a handful of the few people that work on this. The potential impact on CDR and the exact reasons are still unknown, but it appears to be related to the specific combinations of rock and soil, as well as the amounts of rock and irrigation. One possible explanation could be that the added rock acts like fertilizer for plants and microbes, causing them to respire more CO₂. Increased microbial activity may also convert existing carbon in the soil into additional emissions through decomposition, an outcome we'd prefer to avoid. On a more positive note, some studies indicate that over the long term, the rock might stabilize soil organic matter within Mineral-associated organic matter (MAOM). This would be a beneficial effect, providing a form of carbon storage that could last for decades or even centuries. These interactions between biological processes and rock weathering are complex and not yet fully understood. Further research is needed to unravel the connections and determine how they might be harnessed to enhance carbon capture (or if the additional emissions need to be factored into the lifetime analysis of ERW).
Stage 4: This final stage considers the losses and delays in transporting and storing carbon. Some carbon might remain hidden in groundwater, becoming a permanent but unmeasurable storage. It's like trying to trace a message in a bottle back to its sender after decades at sea.
The Permanent Climate Effect: After navigating through all these stages, we reach the final climate effect of carbon capture and storage, which is however lower than the initially calculated CDR potential. It's a journey filled with twists and turns, and the final effect might only be modeled rather than measured, like forecasting the weather based on current conditions - with uncertainties involved the further your outlook goes.
Next time you discuss MRV for ERW, ensure everyone is on the same page about the 4 stages. Future buyers will likely require a more and more comprehensive view that considers all four stages, possibly relying on models with safety measures until concrete data can validate the results.
Recognize that ERW starts having a positive impact on the climate early in the process. A significant portion of carbon is trapped as soon as the rock reacts with carbonic acid in stage 2, even if we can't immediately quantify it.
Given enough time—decades, in fact—this process will generally lead to a net-positive effect on the climate. In the grand scheme of Earth's climate, this timeframe is more than acceptable. So let's not hold back on advancing ERW as an industry; instead, let's focus on refining our ability to measure its positive impacts.
Note: If you want to dive deeper into this then the CDR Verification Framework for ERW from CarbonPlan is a good place to start your journey.
ERW’s climate effects over time (a visual sample by stage)
We have not yet found a good visual concept to show the delays of 1. capture, 2. storage and 3. quantification. Eventually every ton of CDR potential that makes it past the losses will have a climate effect. The more rock we spread the faster the soil’s parking garages are filled up and the faster the signal moves on. But until then there are various tar pits which delay the transport of cations and eventually alkalinity and with it the desired climate effect. E.g. a cation does not have a climate effect as long as it is “parked” in the CEC or MAOM in stage 3.
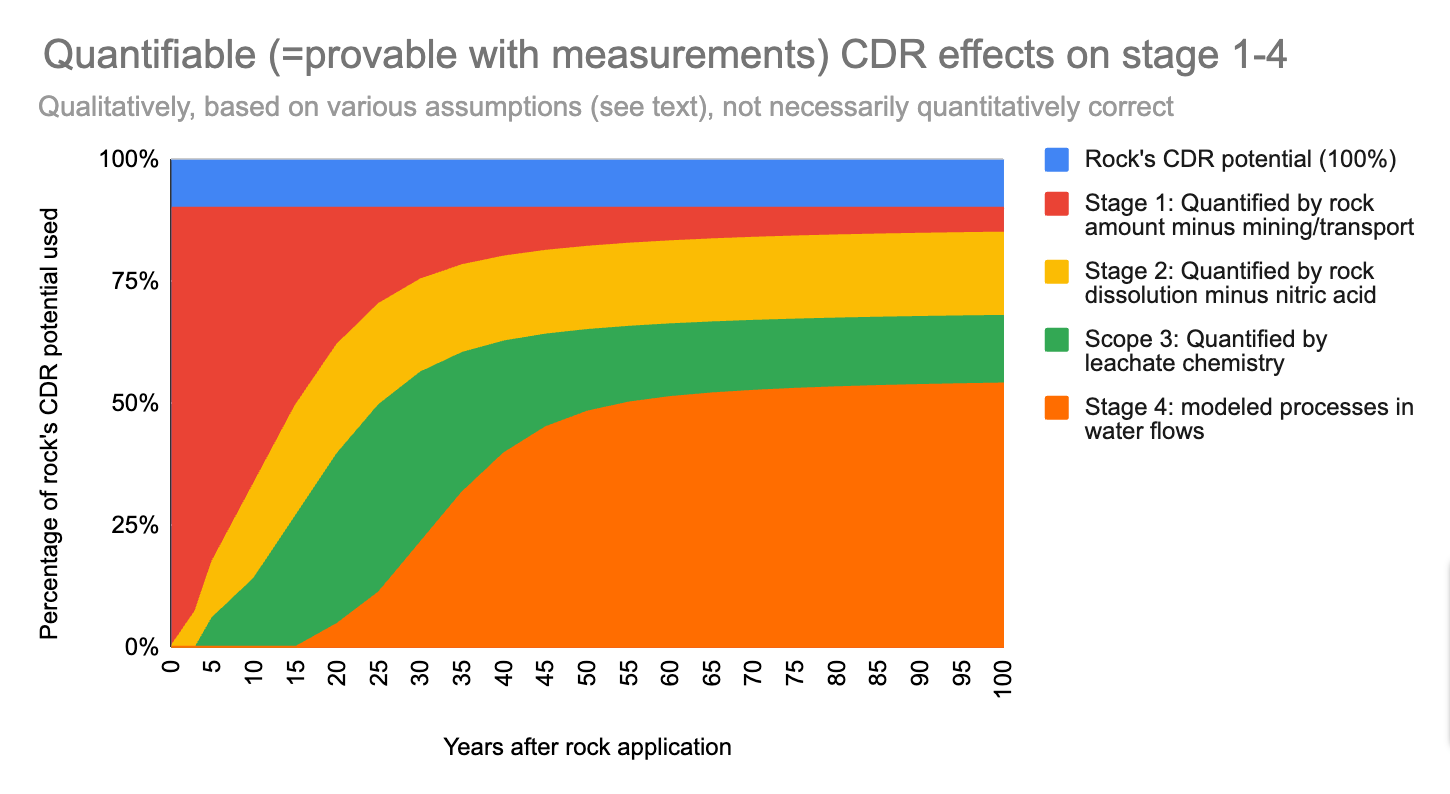
This graph shows what the climate effect of ERW is over time when we look at the 4 stages:
This graph is based on the following reasoning and assumptions:
One time application of rock durst in year 0.
The rock’s lifetime CDR potential is 100% which cannot be reached in reality.
On stage 1 (red) you measure the amount of spread rock and derive the related CDR potential from chemistry, but we need to subtract an assumed 10% for production/transport emissions.
On stage 2 (yellow) we quantify the actual rock dissolution rate using e.g. isotope measurements of soil samples. The graph assumes an annual rock dissolution of 3% of the remaining rock, reaching ca. 50% dissolution rate after 15 years.
A quantifiable signal from the dissolved rock reaches stage 3 (green), the leachate waters, years later (we assume here 5 years for the sake of presentation) with an assumed loss of 20%. Depending on further investigation we would also need to factor in good or bad effects from changes in the Carbon pools in the soils.
It takes another 5 years (or likely more) for the carbonates to reach stage 4 (orange), the rivers and eventually oceans. This line is shown blurred because there does not seem to be a way to quantify these on an individual project basis, so this step has to use models.
In the end we reach the permanent climate effect, which in this example is in the order of 55% of the full lifetime CDR potential of the rock.
Of course the numbers used to create this graph can be disputed and they will be different for different locations, rocks, soils, plants and many other parameters. But from a structural perspective this concept is a simplified base logic to look at quantifiability of CDR through ERW which can be told more easily to the buyer side than much more complex models.
So, next time you buy or sell CDR from ERW, what stage of quantification is your business based on? And what stage of time are you buying/selling CDR for?
Update October 2024
After reading this blog post please also look at our blog article Why measuring alkalinity is not the same as quantifying HCO₃⁻ (How to avoid confusion about the seemingly straightforward use of alkalinity to quantify CO₂2 removal).