What we learnt from a 1400-day enhanced-weathering experiment (1/6)
Enhanced rock weathering is one of the most promising carbon dioxide removal approaches we have. The idea is conceptually simple: mix reactive silicate or carbonate minerals into soil, let them dissolve faster than they would in nature, and let that dissolution turn atmospheric CO₂ into dissolved bicarbonate that can be carried to long-term storage.
In practice, the hard part is not the mixing. The hard part is knowing how much CO₂ a given rock on a given soil actually removes — and being able to measure it over the years that weathering really takes. And almost nobody has years of data.
We do. Our XXL Lysimeter Experiment has now run for 1,400 days — nearly four years, through four winters and four growing seasons — with the leachate sampled roughly monthly and a set of sensors buried in the soil logging every day. Very few enhanced-weathering experiments anywhere are both this long-running and this detailed. That combination — years of duration, daily resolution, a single well-characterised soil — is what makes this dataset worth the wait, and it is what this series is about. (It is the long-running, in-situ companion to our two-year greenhouse study, see the MRV Proxies for EW series.)
Here is what those 1,400 days tell us, stated up front:
At the macro scale, the pots behave beautifully — for each pot we see a strong, reproducible alkalinity flux that tracks the water balance and the seasons, leaving in the drainage where the chemistry says it should.
At the micro scale — the scale where you want to show that more amended rock removed more CO₂ — the dose signal all but disappears. Our unamended control pots remove about as much as the basalt-treated ones. Bummer.
The buried sensors turn out to be the real prize: an electrical-conductivity probe at 60 cm depth tracks leachate chemistry across every treatment, and the in-soil CO₂ sensors see that the soil “breathes” a seasonal CO₂ cycle that drives the whole weathering engine.
That first pair is the tension we keep returning to: great performance at the macro scale, a much messier picture the moment you zoom in on individual doses.
The setup
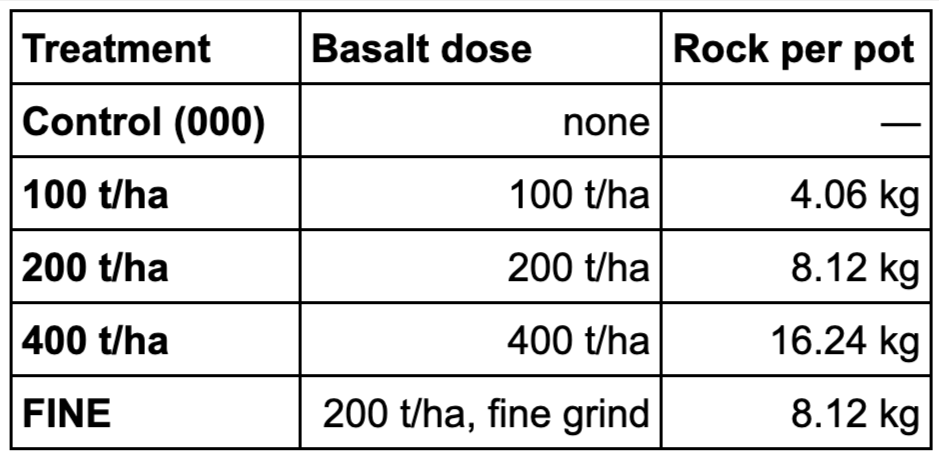
Five treatments, four replicate pots each.
Twenty outdoor lysimeter pots, each 0.406 m² of surface (0.70 × 0.58 m), filled in spring 2022 with a single soil (“Fürth 2022”) and planted. Four to six weeks later we mixed crushed rock into the top 15 cm (except for controls). Five treatments, four replicate pots each.
Water percolates through; roughly monthly we pump out and analyse the leachate — the Sickerwasser — for total alkalinity, major ions, pH and electrical conductivity. Alongside the chemistry, each instrumented pot carries buried probes logging daily: soil moisture, temperature, electrical conductivity and pH at 30 and 60 cm, a soil-CO₂ sensor at ~20 cm in every pot, plus on-site rain gauges and ambient-CO₂ sensors.
For scale: the site received roughly 533, 775, 691 and 548 mm of rain in 2022 to 2025 (official DWD station Nürnberg 03668). Our on-site gauges consistently under-catch — a story in itself for article 6.
The feedstock — and a caveat we plant now
The basalt is “Eifelgold” (Basalt-Union, from the Eifel) — geologically a basanite, silica-poor and rich in fast-dissolving feldspathoids (leucite, nepheline). That mineralogy is why we would expect these rocks to weather quickly. The coarse batch used for 100/200/400 t/ha has a median grain size around 39 µm, a BET surface area of 2.3 m²/g, and a theoretical maximum of 478 kg CO₂ per tonne of rock.
One caveat we plant here and return to later: the “FINE” treatment is not a clean grain-size experiment. By X-ray diffraction the fine batch is a different rock — same supplier, same name, but it shares almost none of the coarse basanite’s minerals. Where the coarse batch is dominated by clinopyroxene, plagioclase, leucite and nepheline, the fine batch is 44 % K-feldspar and 34 % of the fast-weathering zeolite natrolite (both essentially absent from the coarse rock), plus 5 % calcite, whose rapid dissolution alone can produce an early alkalinity surplus. So FINE is not a finer grind of the same rock; when it looks like the front-runner later in this series, remember that it confounds grain size with mineralogy. The full XRD, XRF and grain-size tables travel with the dataset.
What we measure, and how we turn it into CDR
The signal is total alkalinity (TA) in the leachate, interpreted as our bicarbonate (HCO₃⁻) signal. Dissolving silicate or carbonate minerals releases base cations that charge-balance bicarbonate, and exporting that bicarbonate in the drainage is a direct, measurable proxy for carbon captured at the source. We convert measured bicarbonate export to CO₂ at 1 mol CO₂ per mol HCO₃⁻ and normalise per unit surface area, so our headline quantity is the cumulative export of inorganic carbon in the leachate, in tCO₂e/ha — our measured CDR. We name it that way deliberately: it counts only the carbon that leaves dissolved as bicarbonate. Other, unmeasured pathways — chiefly the build-up of stable soil organic carbon — could add to the total; conversely, soil processes that lock base cations into secondary clay minerals or exchange sites (or precipitate secondary carbonate, which re-releases CO₂) remove cations from the drainage and are a loss, not a gain. So this inorganic-leachate number is best read as an upper bound on that one pathway, not a full carbon budget.
One qualifier still matters: this is local CDR — the carbon captured at the pot. The bicarbonate still has to travel through soils, groundwater, rivers and finally the ocean, and a fraction is lost or re-emitted along the way, so a discount applies before this becomes certified, durable CDR. And, as noted above, the leachate captures only the inorganic carbon that drains out — an upper bound on that one pathway.
The dose question, first look
This is where a tidy story would show the highly amended 400 t/ha line pulling clear of the pack. It does not.
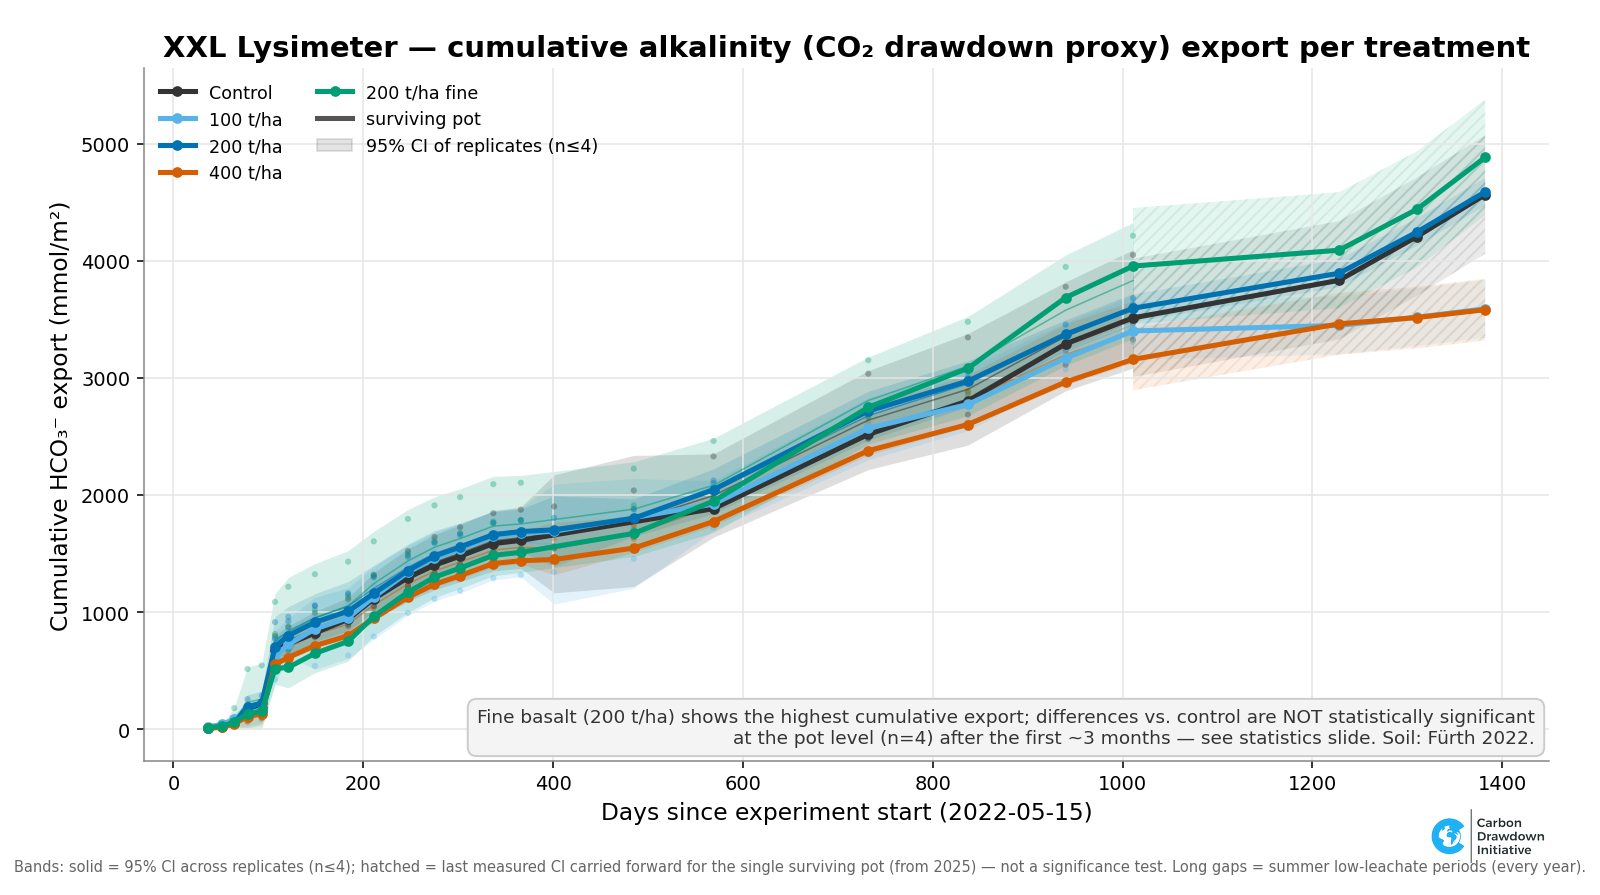
Figure 1: Cumulative bicarbonate export as CO₂-equivalent (tCO₂e/ha = local CDR) per treatment, volume model avgBD. Solid band: 95 % CI across replicate pots (n ≤ 4); hatched band: last measured CI carried forward for the single pot per treatment that continues past the 2025 refill.
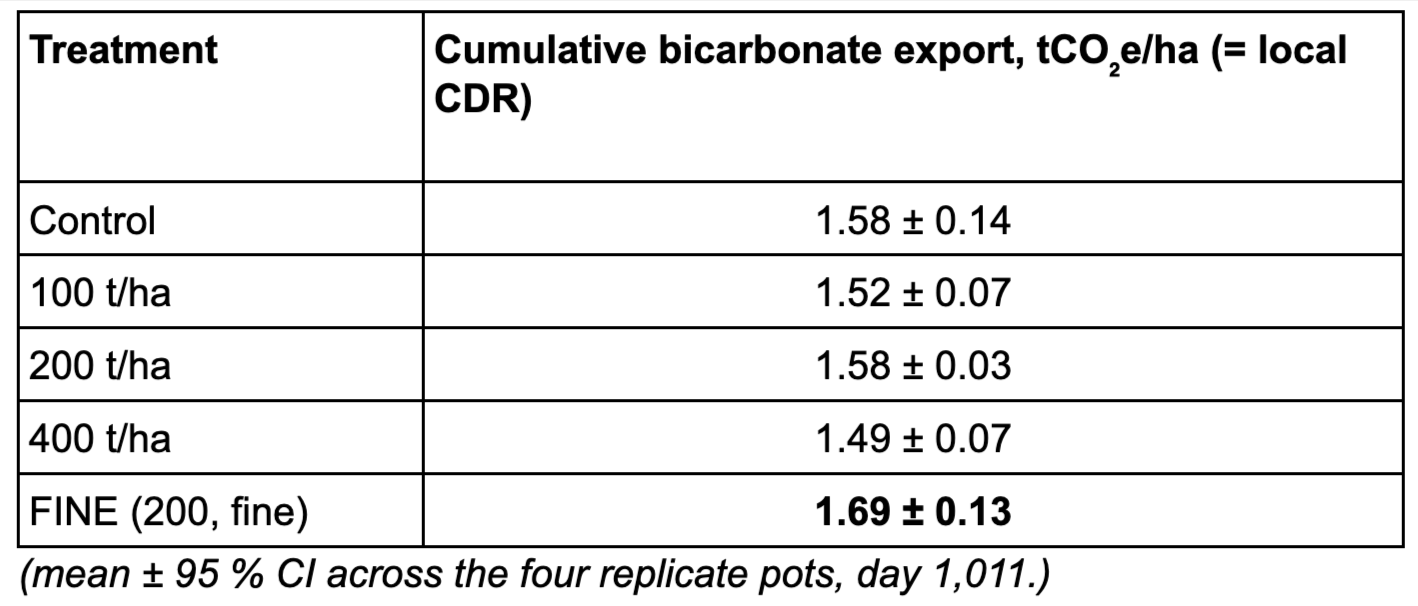
All four replicates of every treatment ran side by side until early 2025 (day 1,011). At that point — the last date with the full n = 4 — cumulative local CDR lands at:
The unamended control (1.58) sits squarely in the pack — above 100 and 400 t/ha, level with 200. FINE noses ahead at 1.69, but its error bar overlaps every other treatment, and (see above) it is a different rock.
There is a strong early alkalinity peak in the first months — but it is not a basalt signal: it is disturbance, not weathering. Several things happen at once when the freshly built, disturbed soil first gets a proper soaking (the heavy thunderstorm of August 2022 that delivered the first real drainage): the loose soil settles and its permeability changes, a flush of pre-existing salts and exchangeable cations is washed out, and the Birch effect adds a burst of microbial mineralisation. It shows up in the controls just as strongly. Once that disturbance flush fades, the treatments simply converge, and by whole-period statistics no dose differs significantly from control. With only four replicate pots per treatment, the experiment does not have the statistical power to resolve the modest differences that remain.
So, in essence, even after almost 1,400 days we do not see any significant “signal” that would tell us: “CDR has happened”. Instead we have proven that we were able to build 20 large pot experiments that behave exactly the same way, even though we put enormous amounts of rock dust on them.
As we have found out in the follow-up greenhouse experiment, we had made a very unfortunate choice of soil and feedstock (this combination behaved similarly in our greenhouse experiment, while other combos worked fine).
But there are still several interesting insights to be gained from this experiment, so we wrote a whole blog series about it:
The XXL Lysimeter dataset (2022-2026) series
Intro article — why a 1,400-day, daily-instrumented experiment is worth the wait.
Dose–response — the initial flush (the Birch effect, not weathering), the long convergence, the n = 4 power problem, and the FINE-is-a-different-rock confound.
The soil breathes — how temperature and soil CO₂ drive a seasonal weathering engine visible in the buried sensors.
A buried EC sensor as a continuous MRV proxy — the 60 cm probe tracks leachate chemistry remarkably well (and the 30 cm one does not); the long-term, in-situ extension of our EC-as-alkalinity-proxy work.
What the soil tells us when it breathes — reading four years of buried CO₂ sensors: the soil as a living system of warmth, water and microbes — and why even a sensor in every pot is the weathering engine, not a carbon meter.
Four years of buried sensors — rainfall, ambient CO₂, and the reality that most field sensors die within two to three years.
All of it is reproducible: the data, code and figures behind every article ship as an open, versioned dataset (our XXL Lysimeter Experiment, Fürth-2022 soil), released alongside this series under CC-BY-4.0 — doi.org/10.5281/zenodo.21216439 (GitHub: dirkpaessler/carbdown_xxl_lysimeter_2022_2026).
References and further reading
Setting up the Carbdown Greenhouse Experiment 2023 (With Recipe And Shopping-list) https://www.carbon-drawdown.de/blog/2023-3-16-setting-up-the-carbdown-greenhouse-experiment-2023-with-recipe-and-shopping-list
Hammes et al. (2025), Soil processes govern alkalinity and cation retention in enhanced weathering for carbon dioxide removal, EGUsphere preprint, https://doi.org/10.5194/egusphere-2025-5402 (the Birch-effect / initial-flush framing).
Our greenhouse EW series — MRV Proxies for EW: a guided tour (Part 1 of 9): https://www.carbon-drawdown.de/blog/2026-1-23-19-mrv-proxies-for-ew-a-guided-tour-through-our-data-from-our-two-year-greenhouse-experiment
Total Alkalinity and Electrical Conductivity as MRV Proxies for Enhanced Weathering (PDF): https://www.carbon-drawdown.de/s/Total-Alkalinity-and-Electrical-Conductivity-as-MRV-Proxies-for-Enhanced-Weathering_-Insights-from-a-jtnx.pdf
XXL Lysimeter project introduction (2022-02): https://www.carbon-drawdown.de/blog/2022-2-22-introducing-the-carbdown-xxl-lysimeter-project
Photo logbook — building the XXL lysimeters (2022-06): https://www.carbon-drawdown.de/blog/2022-6-13-photo-logbook-building-the-xxl-lysimeter-weathering-experiment-part-1
Biomass assessment of weathering in the XXL lysimeters (2022-10): https://www.carbon-drawdown.de/blog/2022-10-9-biomass-assessment-of-weathering-in-the-xxl-lysimeters
Whitepaper — What We Learned from the World’s Largest Greenhouse Experiment (Jan 2025), Tables 5–7 (feedstock characterization): https://www.carbon-drawdown.de/blog/2025-1-29-what-we-learned-from-the-worlds-largest-greenhouse-experiment