Does more basalt mean more CO₂ removal? What 1400 days actually show
Our XXL Lysimeter Experiment, Article 2 of 6
The intuition behind enhanced weathering is a straight line: more rock means more mineral surface, more surface means more dissolution, more dissolution means more captured CO₂. Spread twice as much basalt, remove roughly twice as much carbon. If that line held, our 400 t/ha pots should sit far above the 100 t/ha pots, and both far above the unamended control.
Over 1,400 days, that line does not hold. This is the article where we look straight at the dose–response question — and give the answer the data actually supports, not the one the brochure promises.
The numbers, with error bars
All four replicate pots of every treatment ran side by side until early 2025 (day 1,011), the last date with the full n = 4. Cumulative local CDR at that point:
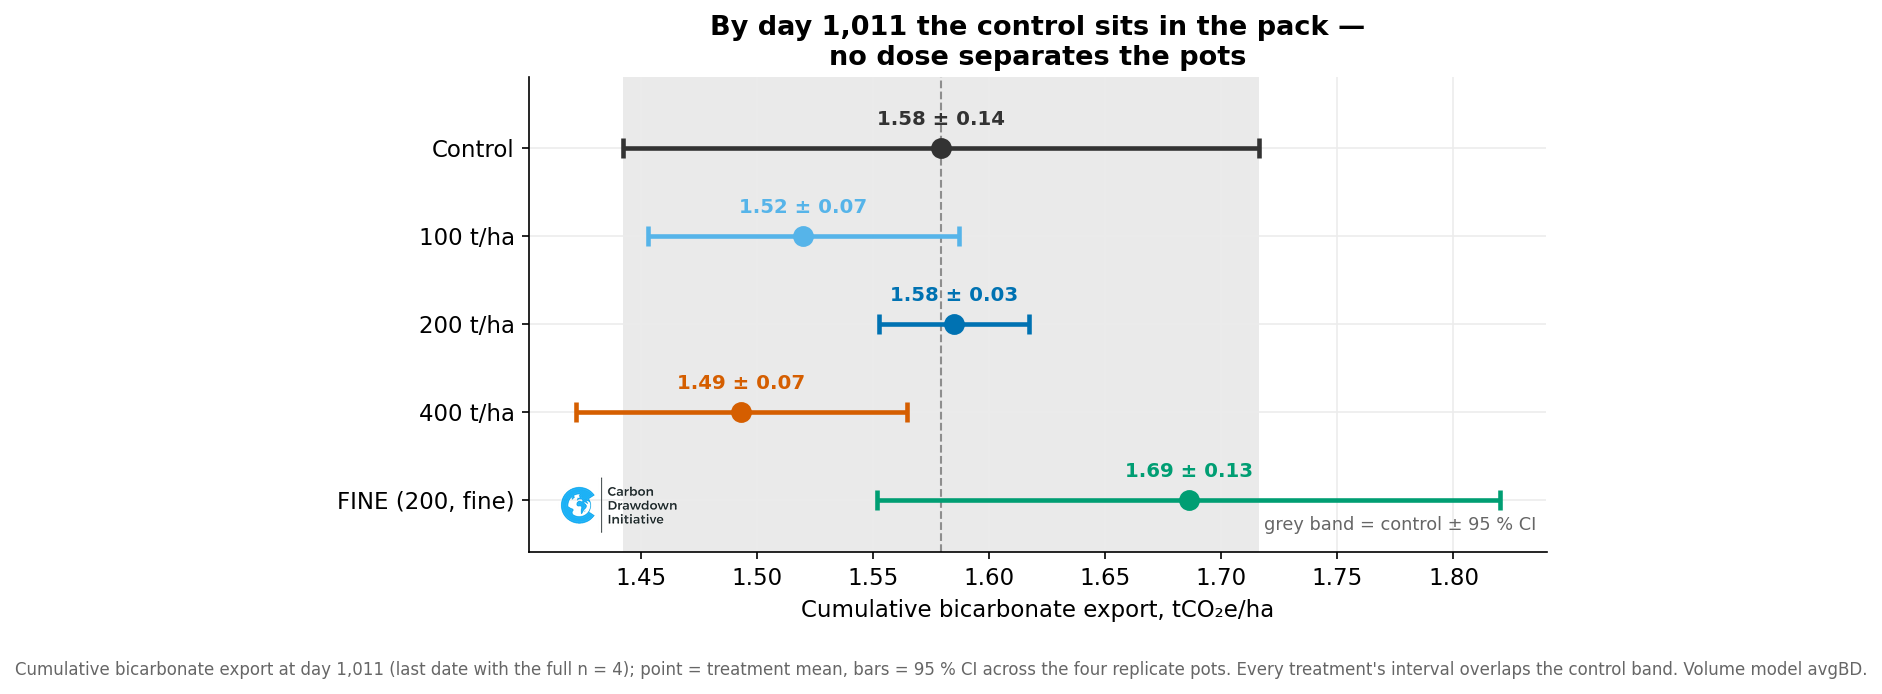
Figure 1: Cumulative bicarbonate export per treatment at day 1,011 (last date with the full n = 4); point = mean, bars = 95 % CI across the four replicate pots. Every treatment’s interval overlaps the control band (grey). Control 1.58 ± 0.14, 100 t/ha 1.52 ± 0.07, 200 t/ha 1.58 ± 0.03, 400 t/ha 1.49 ± 0.07, FINE 1.69 ± 0.13 tCO₂e/ha. Volume model avgBD.
The control is not at the bottom. It is in the middle — level with 200 t/ha, above both 100 and 400 t/ha. The dose ladder we expected is simply not there. Every error bar overlaps every other. Whatever the basalt is doing to alkalinity export at this site, over these four years, it is smaller than the pot-to-pot scatter of the soil itself.
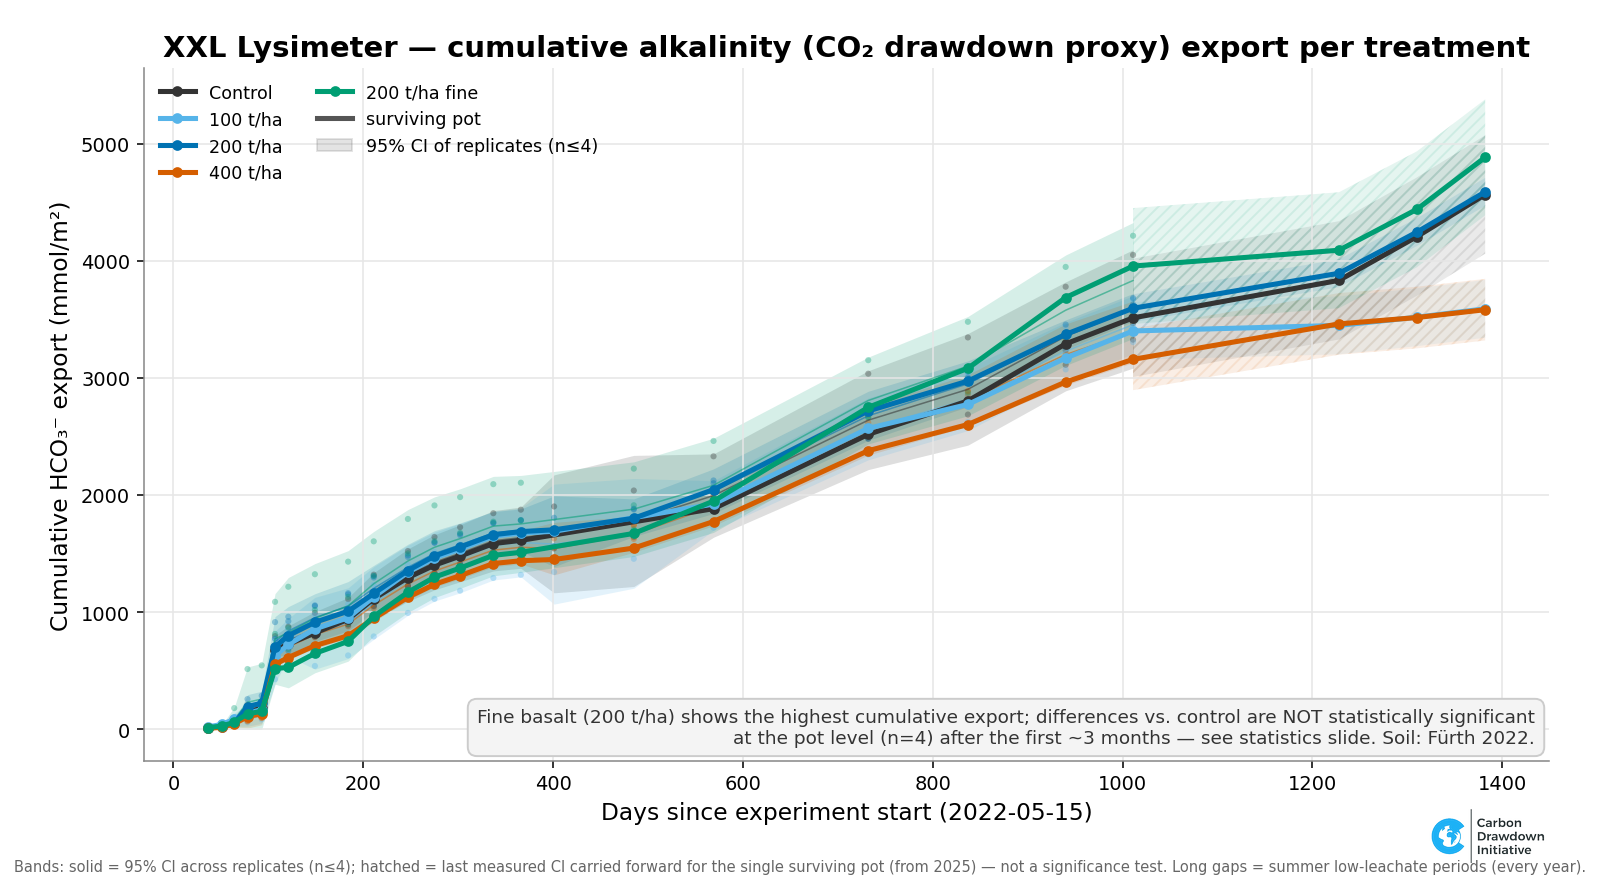
Figure 2: The same export as a time series, per treatment (tCO₂e/ha = local CDR), volume model avgBD. Solid band: 95 % CI across replicate pots (n ≤ 4); the lines stay bunched throughout.
The early peak is disturbance, not weathering
The obvious objection is that the basalt surely showed its hand early, before the doses converged. The data say no — and the reason is worth spelling out, because the first big signal in this experiment is not weathering at all.
The soil was built in spring 2022 — sieved, homogenised, shovelled into the pots — and then stayed relatively dry until a heavy thunderstorm in August 2022 delivered the first real drainage to the tanks. You can see it in the volumes: the pumped leachate jumps from ~2–5 L per sampling to ~40 L on 30 August. That first big soaking of freshly built soil sets off several disturbance processes at once, none of them weathering: the loose soil is still settling, so it drains more freely than the compacted structure it becomes later; a flush of pre-existing salts and exchangeable cations is washed out; and dormant microbes revive in a burst of mineralisation — the Birch effect. Together these drive the initial alkalinity and EC peak (concentrations climb to ~5,200 µmol/L by September–October, then fall back), and the fingerprint is a salt flush as much as a respiration one: TA, Ca, Mg and Na all rise and fall together, with sodium — which has no weathering-carbonate source — tracking alkalinity most tightly of all (r ≈ 0.90). It is a short-term response to disturbance, not the long-term weathering signal, and it appears in the controls just as strongly as in the amended pots. We treat the first ~90 days as unrepresentative, exactly as in our greenhouse work — not every EC increase is weathering; sometimes it is just salts (greenhouse series, Part 3). Our own companion column experiment shows the same on a longer record: an intense rainfall after a dry spell produced a flushing event that contributed roughly a quarter of the total alkalinity export over an 850-day run (Hammes et al., 2025) — again a disturbance signal, not weathering.
So we tested for a dose effect the right way, comparing each treatment against control at day 90, day 180, day 400 and day 1,011. At no horizon is any dose significantly different from control (Welch’s t, n = 4, all p > 0.28). The early scatter is the largest of all — at day 90, FINE sits +48 % and 200 t/ha +25 % above control — but with p = 0.45 and 0.29, that is the Birch flush and pot-to-pot noise, not a dose signal.
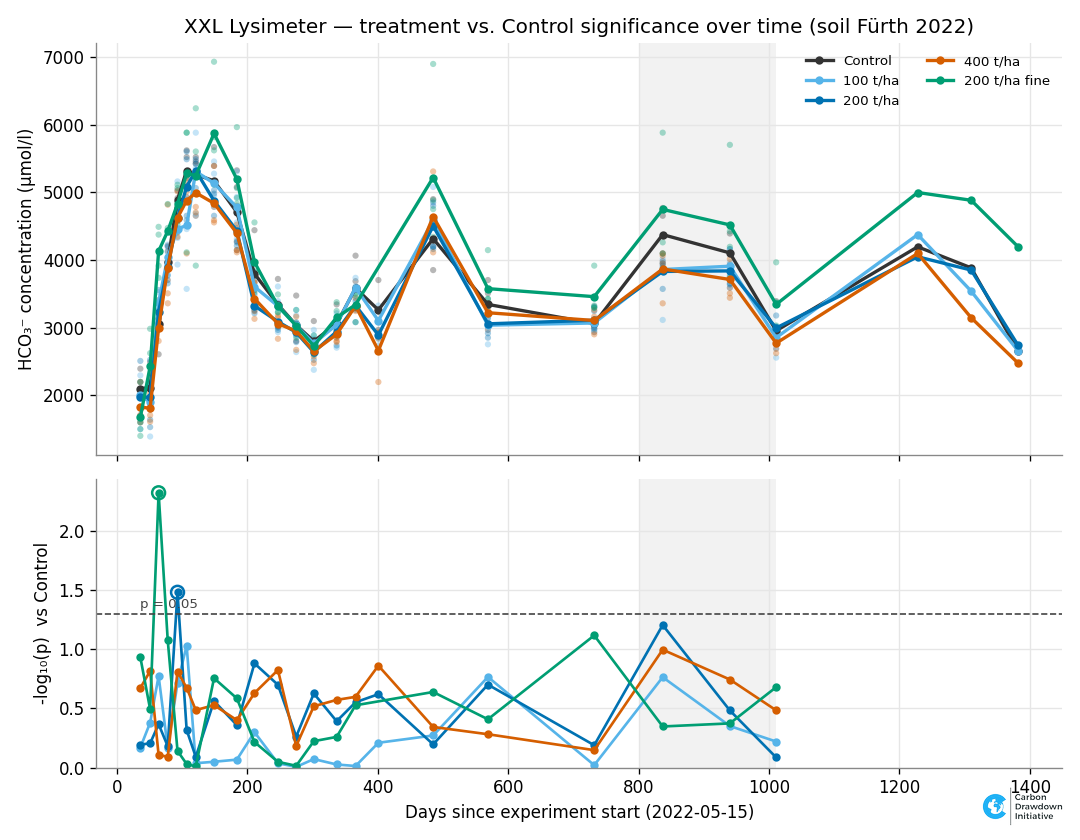
Figure 3: Difference of each treatment vs control over the day 800–1,011 window; none is significant after Holm correction (n = 4 pots per treatment).
The whole-period picture agrees. A log-linear mixed model over all samplings puts FINE at +6 % in concentration and +9 % in export versus control, and 100/200/400 t/ha within a few percent of control — none of it significant.
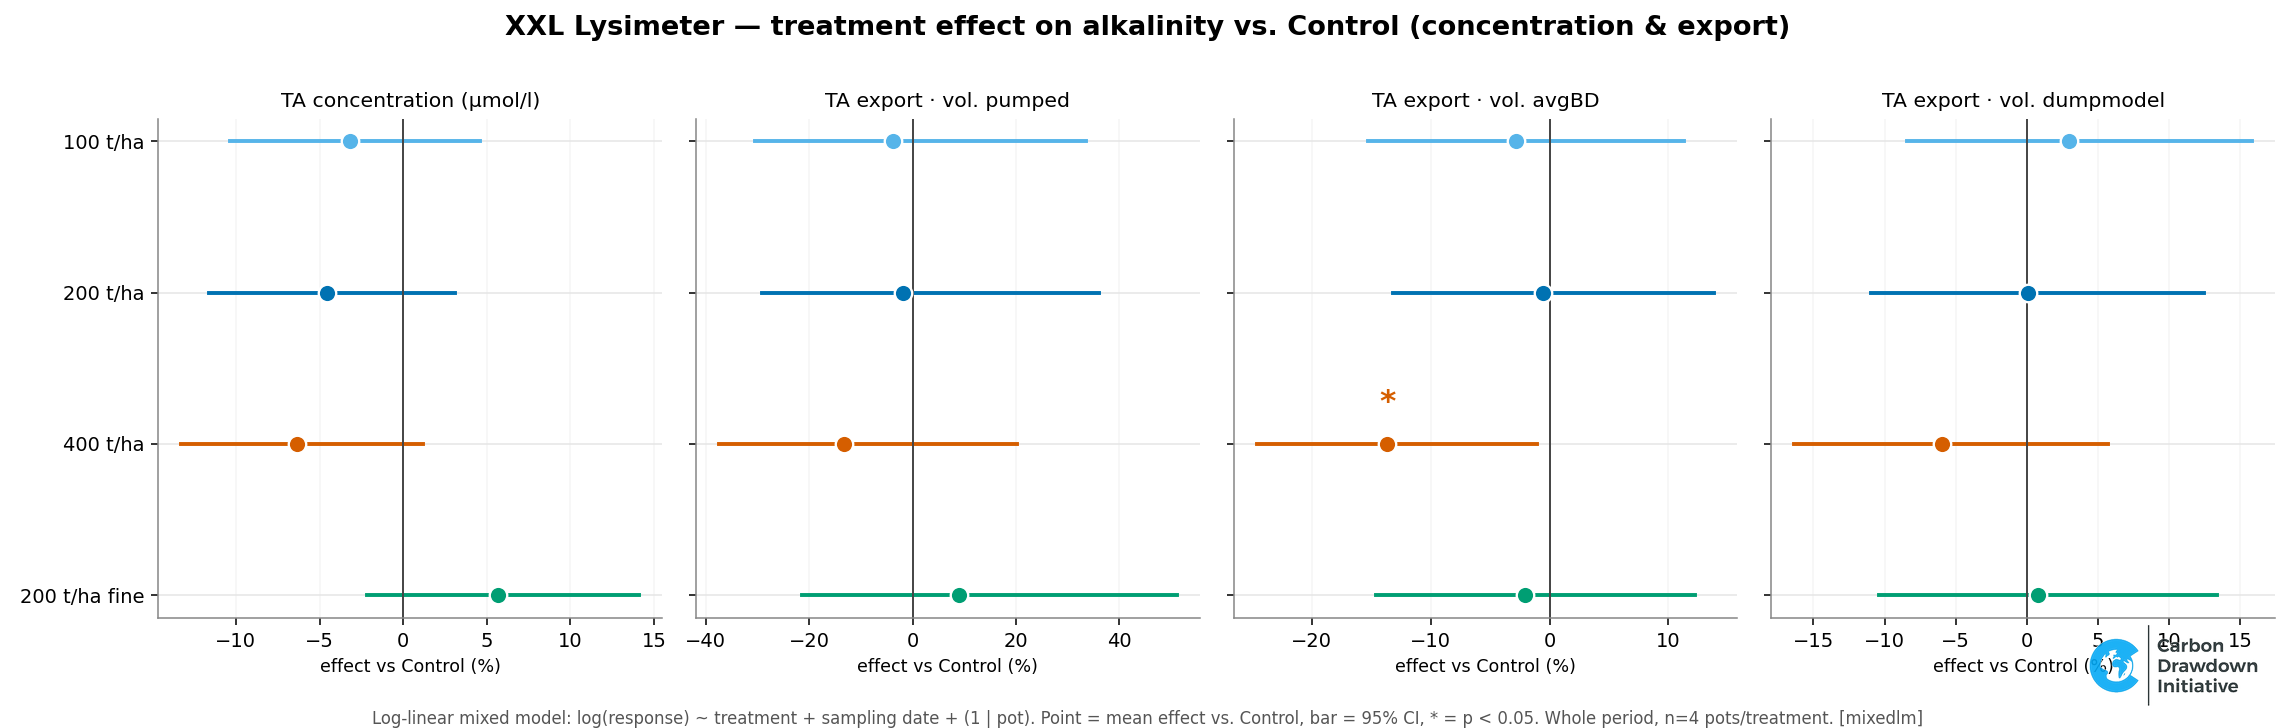
Figure 4: Mixed-model treatment effects vs control (%), for concentration and three volume models; point = mean effect, bar = 95 % CI. Almost every interval crosses zero.
There is one nominally significant result worth naming precisely so it is not over-read: under the avgBD volume model, 400 t/ha comes out −14 % versus control (p = 0.034) — a negative effect that vanishes under the other two volume models (p = 0.39 and 0.30). More basalt producing less alkalinity is not a mechanism we believe; it is what a single volume model plus pot heterogeneity plus multiple comparisons will occasionally hand you. It is a caution, not a finding.
Why the signal hides
Three reasons, and all matter for anyone planning field MRV.
The baseline is large — and part of it is not weathering at all. An unamended control pot at this site “exports” ~1.6 tCO₂e/ha of bicarbonate over four years. But that gross number is not four years of weathering: it includes the Birch-effect flush, carbonate traces and organic-matter turnover — the disturbance baseline we met in the early peak. The basalt signal we want to credit has to stand out above that moving baseline — and here it does not clear the noise.
Two things follow. For the dose comparison, none of this is a problem: every pot got the same disturbance and the same shared baseline, so these common terms cancel exactly when we net against control — the “no significant dose effect” result is robust to them. For the absolute CDR number, they matter: the real weathering-attributable removal is lower than the gross figures above.
n = 4 is not much power. With four pots per treatment and pot-to-pot scatter of order ±0.1 tCO₂e/ha, only a large dose effect would show up as significant. A modest but real effect — say 10–15 % — would sit inside the error bars, exactly where FINE sits now. Absence of significance here is not proof of absence of weathering; it is proof that this design cannot resolve the difference. That is worth stating plainly.
And some weathering never reaches the drainage. Our metric counts only the inorganic carbon that leaves dissolved in the leachate. But base cations released by weathering can be held on the soil’s exchange sites or built into secondary clay minerals before they ever drain out — and where secondary carbonate precipitates, it even re-releases CO₂. Those retained cations, and the alkalinity that would have charge-balanced them, stay locked in the solid phase, invisible to a leachate sampler. So a real dose effect could be partly hidden in the soil rather than absent — which is exactly why the solid phase, not just the drainage, belongs in serious weathering MRV (article 6).
The FINE trap
FINE is the one treatment that trends highest, and it is tempting to read that as “finer grinding works.” It is not that simple. By XRD the fine batch shares almost none of the coarse basanite’s minerals: it is 44 % K-feldspar and 34 % natrolite (both essentially absent from the coarse rock), with 5 % calcite, and it lacks the leucite, nepheline and plagioclase that define the coarse batch — a different rock, not a finer grind. Its calcite alone can manufacture an early alkalinity surplus. FINE therefore confounds grain size with mineralogy, so its +6 % tells us nothing clean about fineness. We flagged this in article 1 and we hold to it.
What this means for MRV
At a single, well-characterised, well-replicated site, over four years, we could not demonstrate a dose–response in alkalinity export. That is not an argument against enhanced weathering — our greenhouse work shows strong, rock-specific weathering across many soils. It is an argument against a specific, common shortcut: treating dose–response as a settled, universal rule you can assume rather than measure. The soil’s own flux can rival the signal; small plots have limited power; and control-netting (comparing against unamended pots on the same soil) is not optional. Any MRV scheme that credits “more rock = more CDR” without measuring against a real control on the real soil is crediting an assumption.
Next in the series: What sensor data told us.
The XXL Lysimeter dataset (2022-2026) series
Intro article — why a 1,400-day, daily-instrumented experiment is worth the wait.
Dose–response — the initial flush (the Birch effect, not weathering), the long convergence, the n = 4 power problem, and the FINE-is-a-different-rock confound.
The soil breathes — how temperature and soil CO₂ drive a seasonal weathering engine visible in the buried sensors.
A buried EC sensor as a continuous MRV proxy — the 60 cm probe tracks leachate chemistry remarkably well (and the 30 cm one does not); the long-term, in-situ extension of our EC-as-alkalinity-proxy work.
What the soil tells us when it breathes — reading four years of buried CO₂ sensors: the soil as a living system of warmth, water and microbes — and why even a sensor in every pot is the weathering engine, not a carbon meter.
Four years of buried sensors — rainfall, ambient CO₂, and the reality that most field sensors die within two to three years.
References
Hammes et al. (2025), Soil processes govern alkalinity and cation retention in enhanced weathering for carbon dioxide removal, EGUsphere preprint, https://doi.org/10.5194/egusphere-2025-5402 (the Birch-effect / initial-flush framing).
Greenhouse series, Part 3 — Transient disturbances: initial flush and fertilizer event: https://www.carbon-drawdown.de/blog/2026-1-23-49-transient-disturbances-initial-flush-and-fertilizer-event
Data, code & figures:doi.org/10.5281/zenodo.21216439 (CC-BY-4.0) · github.com/dirkpaessler/carbdown_xxl_lysimeter_2022_2026