New paper: Evaluating carbon dynamics for enhanced weathering
We’ve just released a deep-dive analysis from our EW greenhouse experiment—two full years of paired measurements tracking both soil CO₂ efflux (the carbon leaving upward as gas) and leachate total alkalinity (TA) (the carbon moving downward in water). The study compiles ~6,500 leachate samples and ~1 million CO₂ efflux readings across >400 pots (data covers 67 rock–soil variants, 4 replicates each), using our custom “fluxmeter army.”
What we set out to test
Enhanced weathering (EW) is promising, but different carbon pathways don’t necessarily move in lockstep. We therefore monitored both gaseous and dissolved carbon flows over time to ask: Do CO₂ efflux and TA tell the same story—or different ones?
Headline findings (from the abstract)
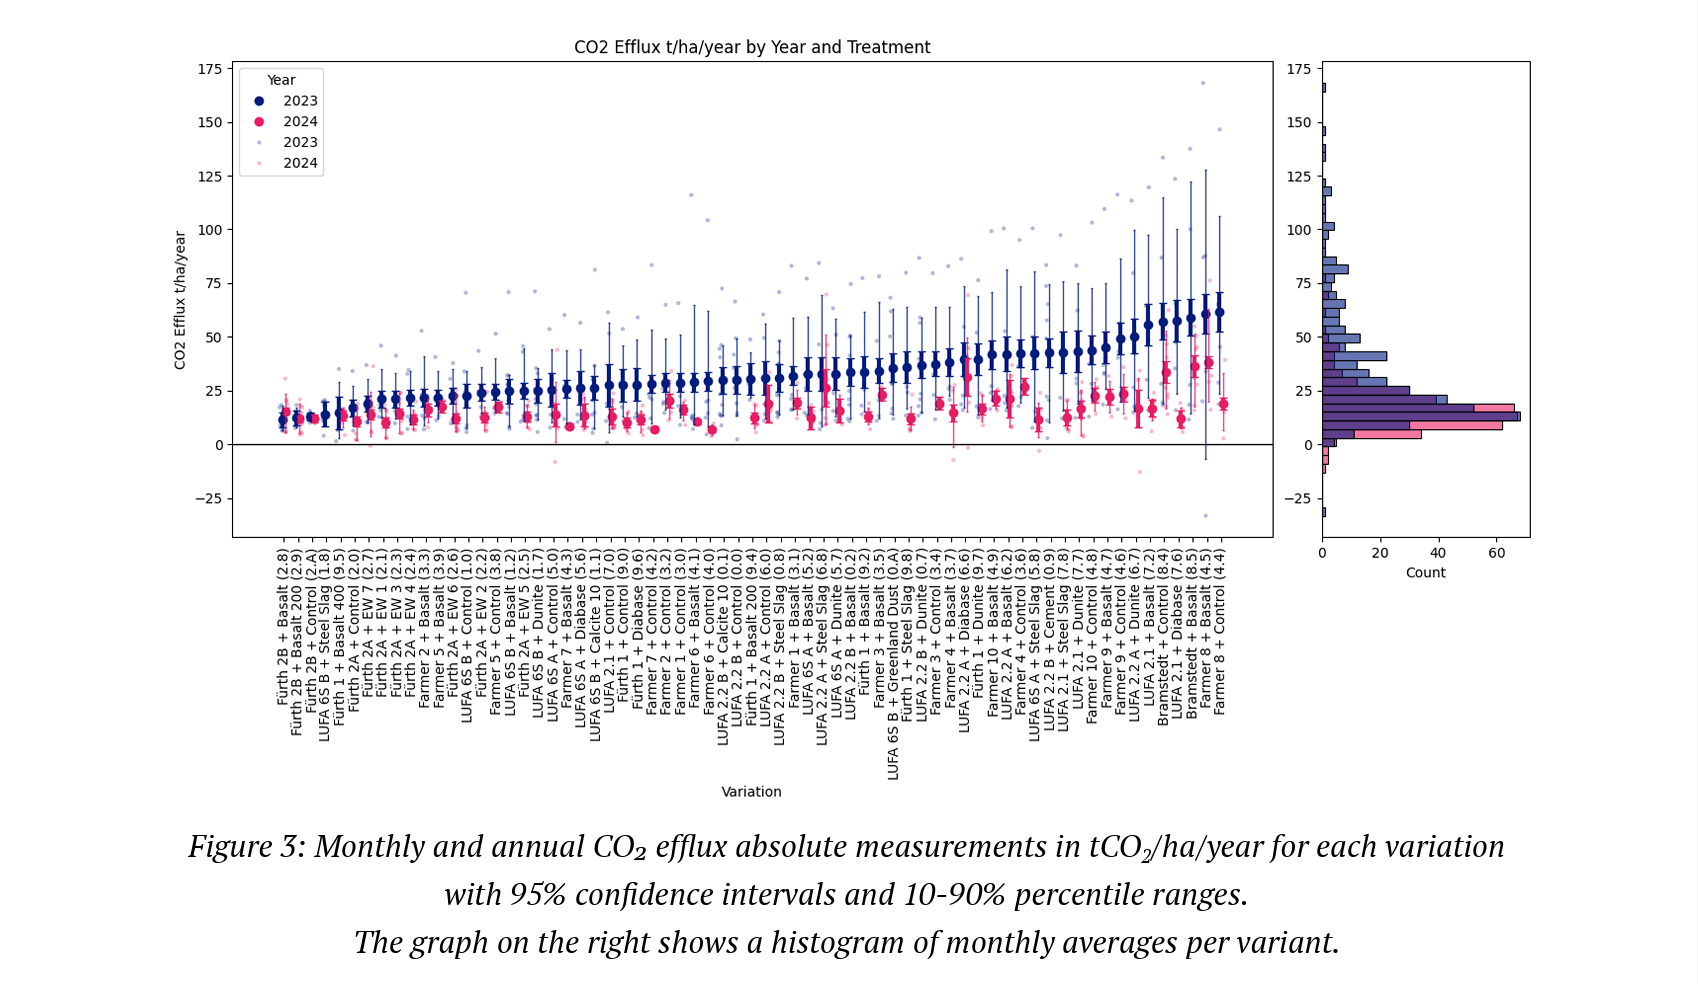
A big year-one pulse in CO₂ efflux—then a fade. In the first 10–20 weeks, all pots (including controls) showed much higher CO₂ efflux than in year two, with a steady decline thereafter. The most likely drivers are soil disturbance/aeration during pot setup and the well-known “Birch effect” after rewetting dry soil. By year two, efflux patterns no longer correlated with year one.
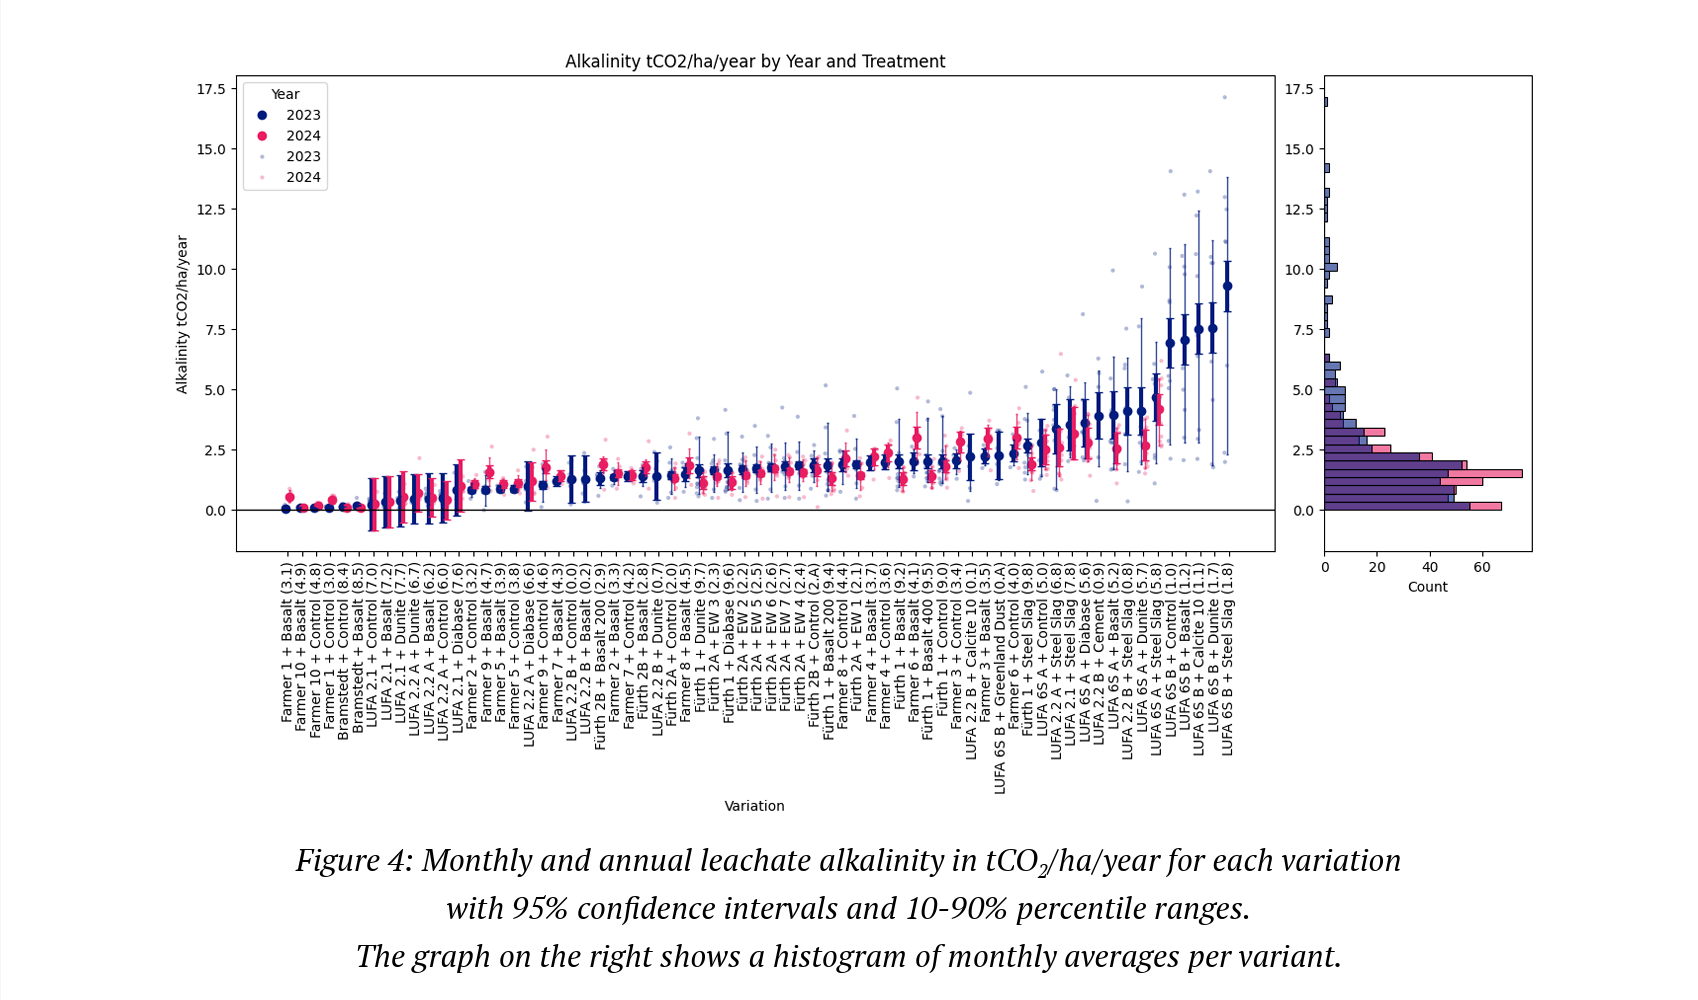
Leachate alkalinity behaved differently. TA also spiked early, but after ~10–20 weeks it settled into a steadier, seasonally modulated signal that looked broadly similar across both years—without the dramatic collapse seen in efflux.
Decoupled signals. The magnitude, timing and variability of the gaseous and dissolved fluxes do not track one another, so TA cannot be used as a proxy for CO₂ efflux (or vice versa).
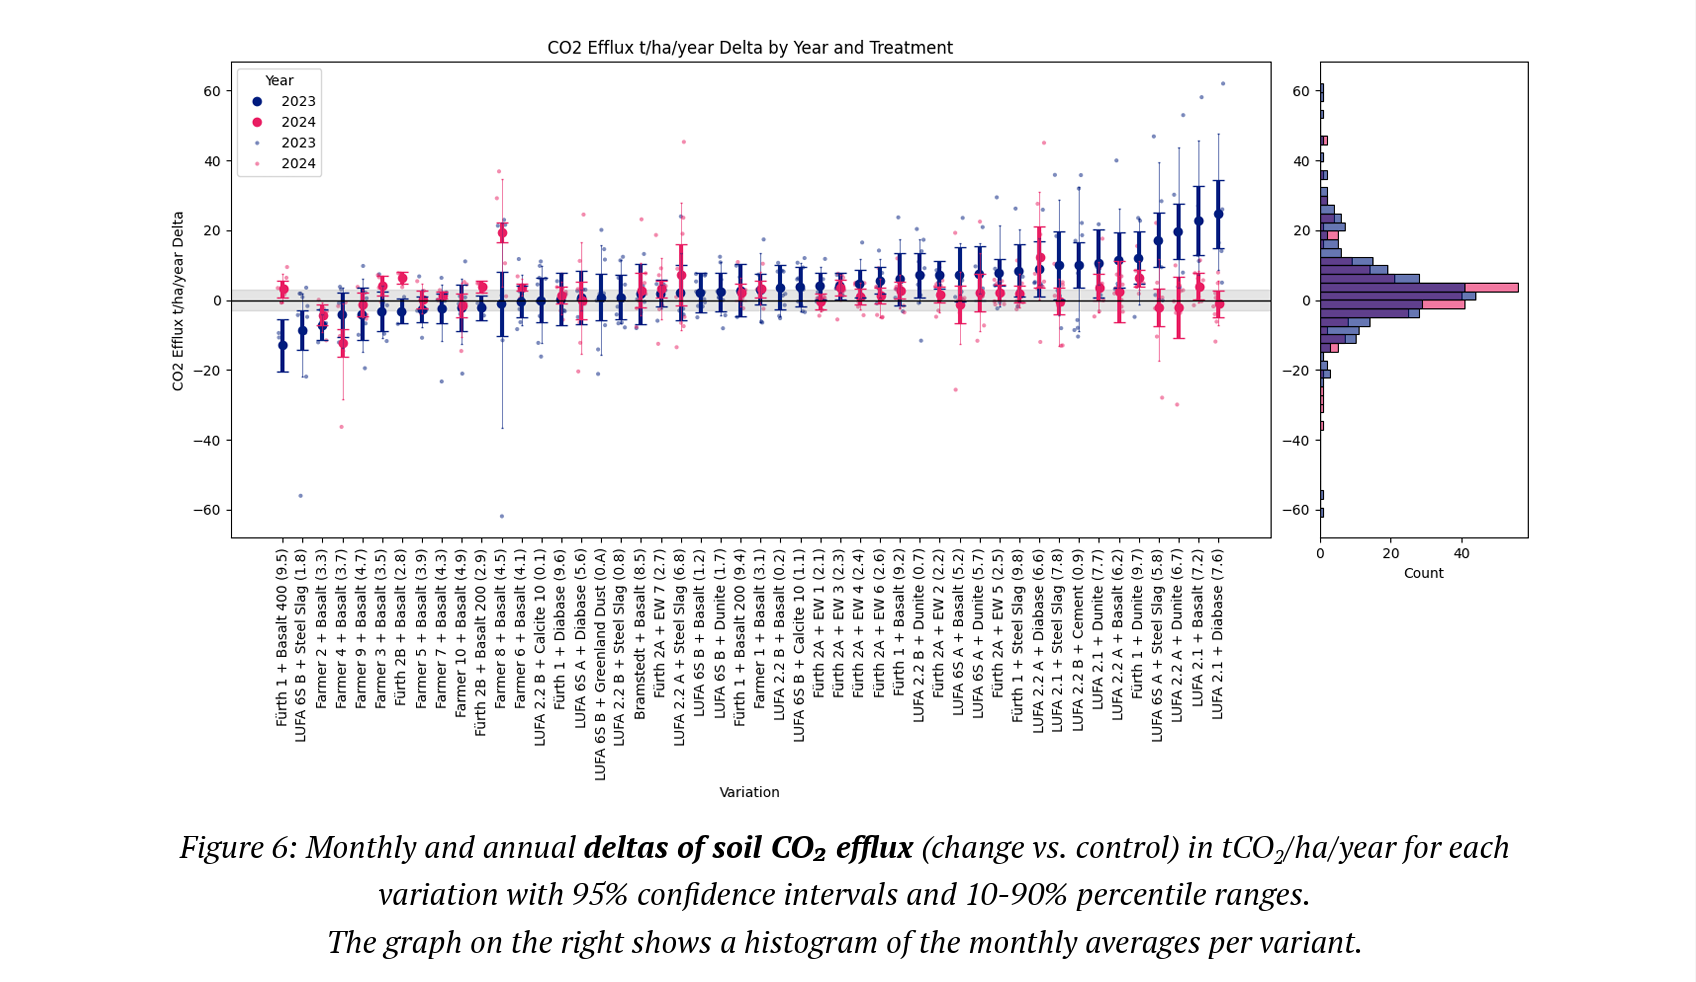
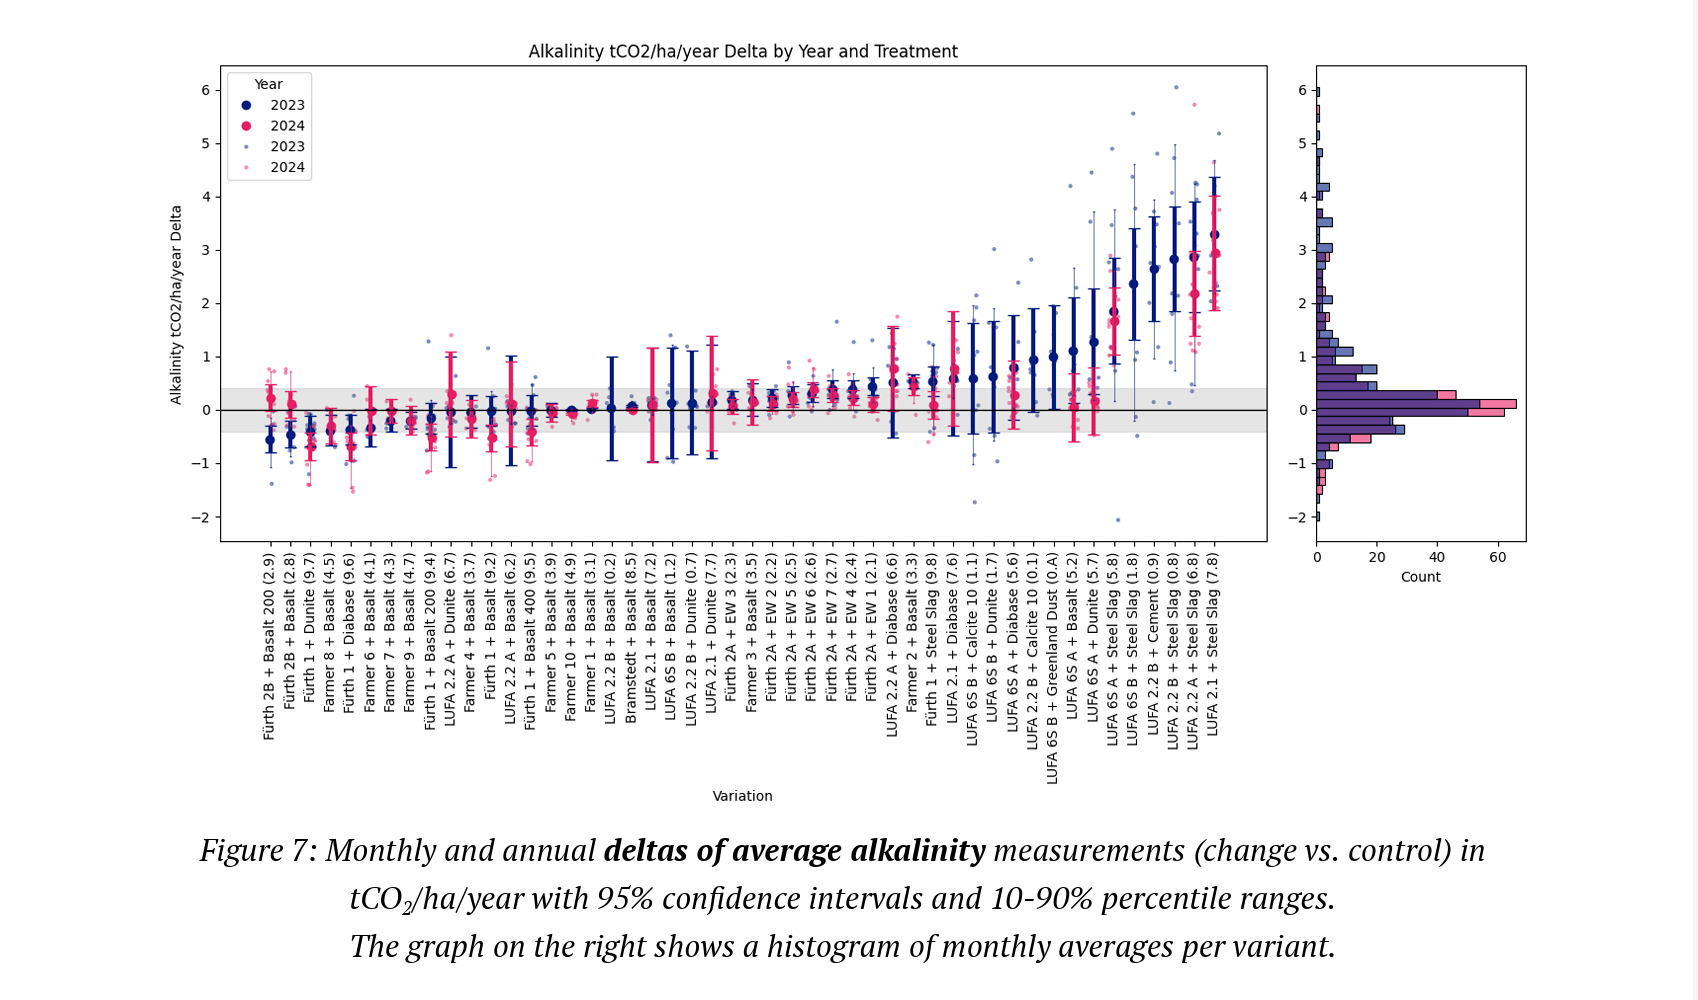
Treatment vs. control: short-lived efflux changes, patchy TA gains. In year one, 42% of treated variants showed increased CO₂ efflux vs. their controls, but these differences mostly vanished in year two. For TA, 35% of treated variants increased in year one and 23% in year two, without consistent correlation to the efflux deltas.
Three phases matter. The dataset consistently falls into: (1) weeks 0–10/20 dominated by setup/disturbance effects, (2) the remainder of year one, and (3) year two; both with noticeable seasonality layered on top. This means short experiments are potentially a poor basis for long-term predictions.
Rock × soil specificity. Each rock–soil combination must be assessed on its own; “averaging away” the pairings risks hiding working combinations among non-working ones and underestimating EW’s CDR potential.
Mind the missing pieces of the carbon budget. Upward efflux (∼10–50 tCO₂/ha/yr) is an order of magnitude larger than downward TA export (∼0–10 tCO₂/ha/yr) in these lysimeters. To close the carbon balance we still need changes in soil carbon and plant biomass—the pools that could reconcile opposing flux signals and reveal true CDR.
Why this matters for EW
If you only watch one pathway, you can easily misread what the system is doing. Early CO₂ pulses are real but transient; TA accrues differently and more steadily. Neither alone is the “truth.” For robust MRV and especially for in-depth of the carbon related processes in the soil, we need multi-year monitoring and multi-pool accounting—including soil-organic carbon, possible carbonate formation, and biomass—for each specific rock–soil context.
Where we go next: Looking for collaborators for the analysis of thousands of samples
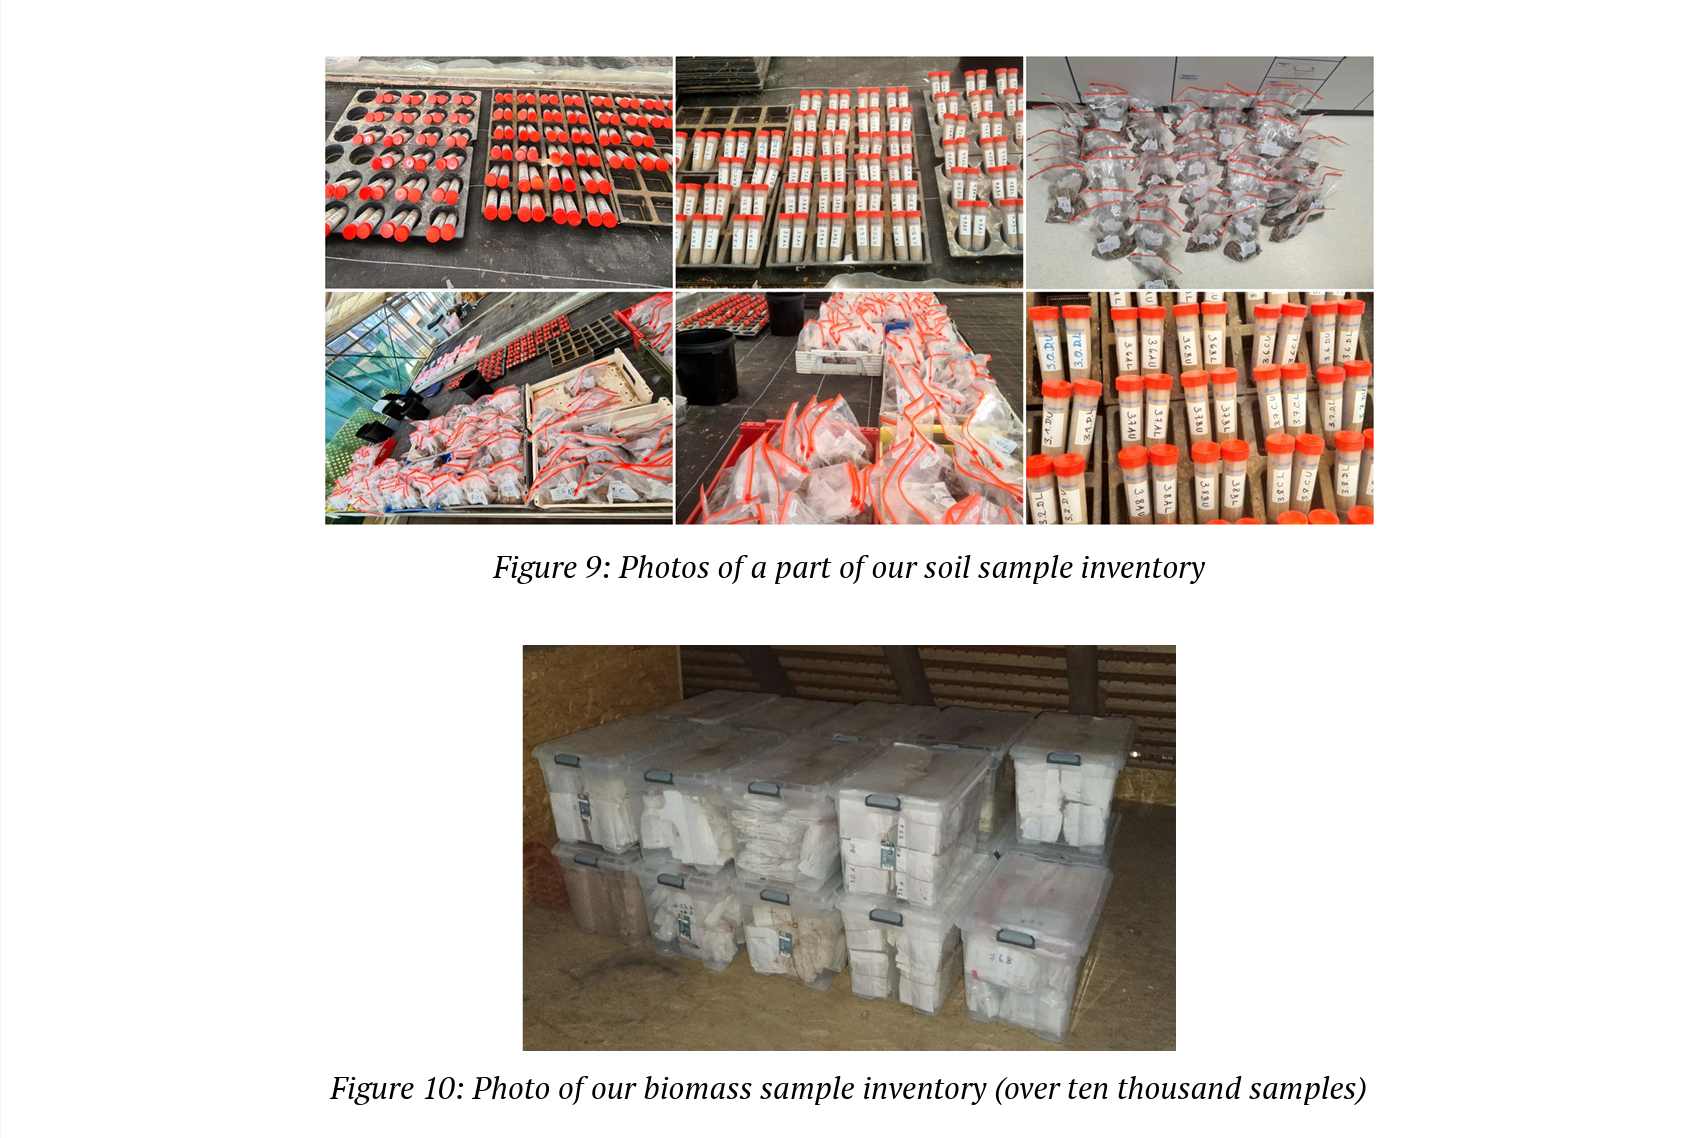
We have thousands of archived soil, rock and biomass samples from 2023/2024 (see photo) —and our ongoing 2025/2026 experiment will more than double that inventory. With this paper we invite collaborators to help analyze these materials so we can complete the mass balance and strengthen EW as a climate tool.
If you’re curious about how EW actually moves carbon through soils, this study offers a rare, side-by-side look at the two main outward pathways—and a clear roadmap for what MRV must include next. Read the paper for the full data story and figures, and reach out if you’d like to collaborate.
PDF Download
Click here to read the paper (pdf, 3 MB, 20 pages plus appendix).
Graphs from the paper
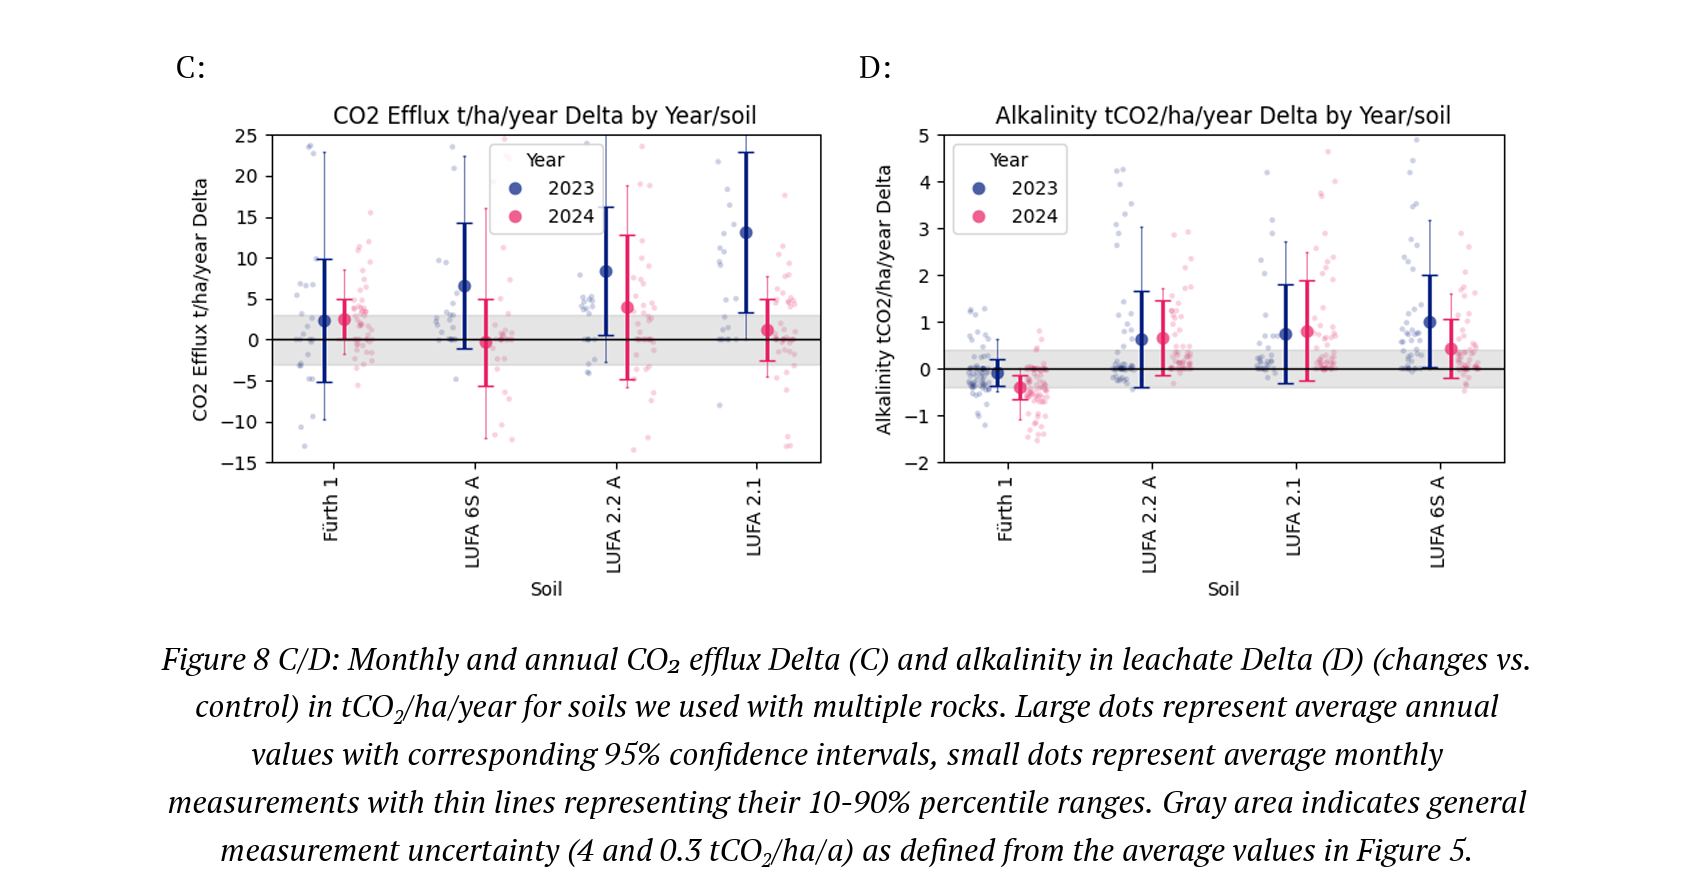
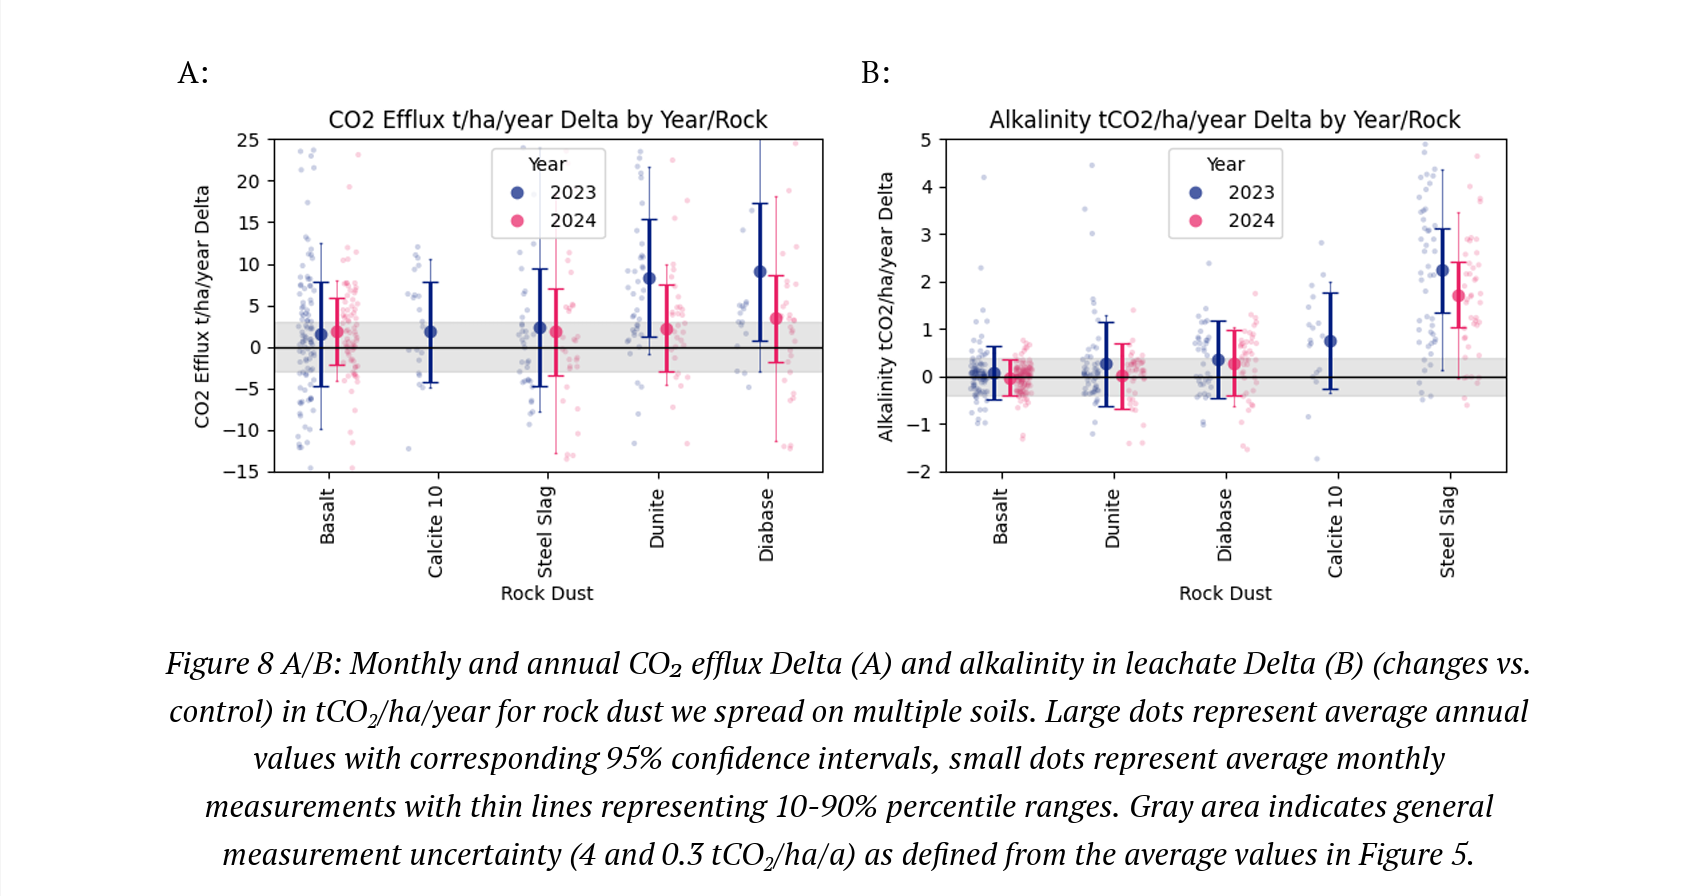
The following graphs show the carbon fluxes in CO2 efflux and leachate TA for 67 variations (=rock/soil combinations) and their deltas to control.
The next row of graphs summarizes the deltas of CO2 efflux and leachate TA for the soils (left) and the rocks (right). The main message from these graphs is that you need to take each individual rock/soil combination into account when assessing CDR potential. When interpreting the data from either only soil or only rock perspective, one can not fully understand the nuances of how specific rocks and soils interact with one another, and hence might underestimate the potential EW results of optimal rock/soil combinations.