
Field and lysimeter experiments · Measurement and MRV
The story of 4 years of in-field weathering observed by 24 dying soil sensors
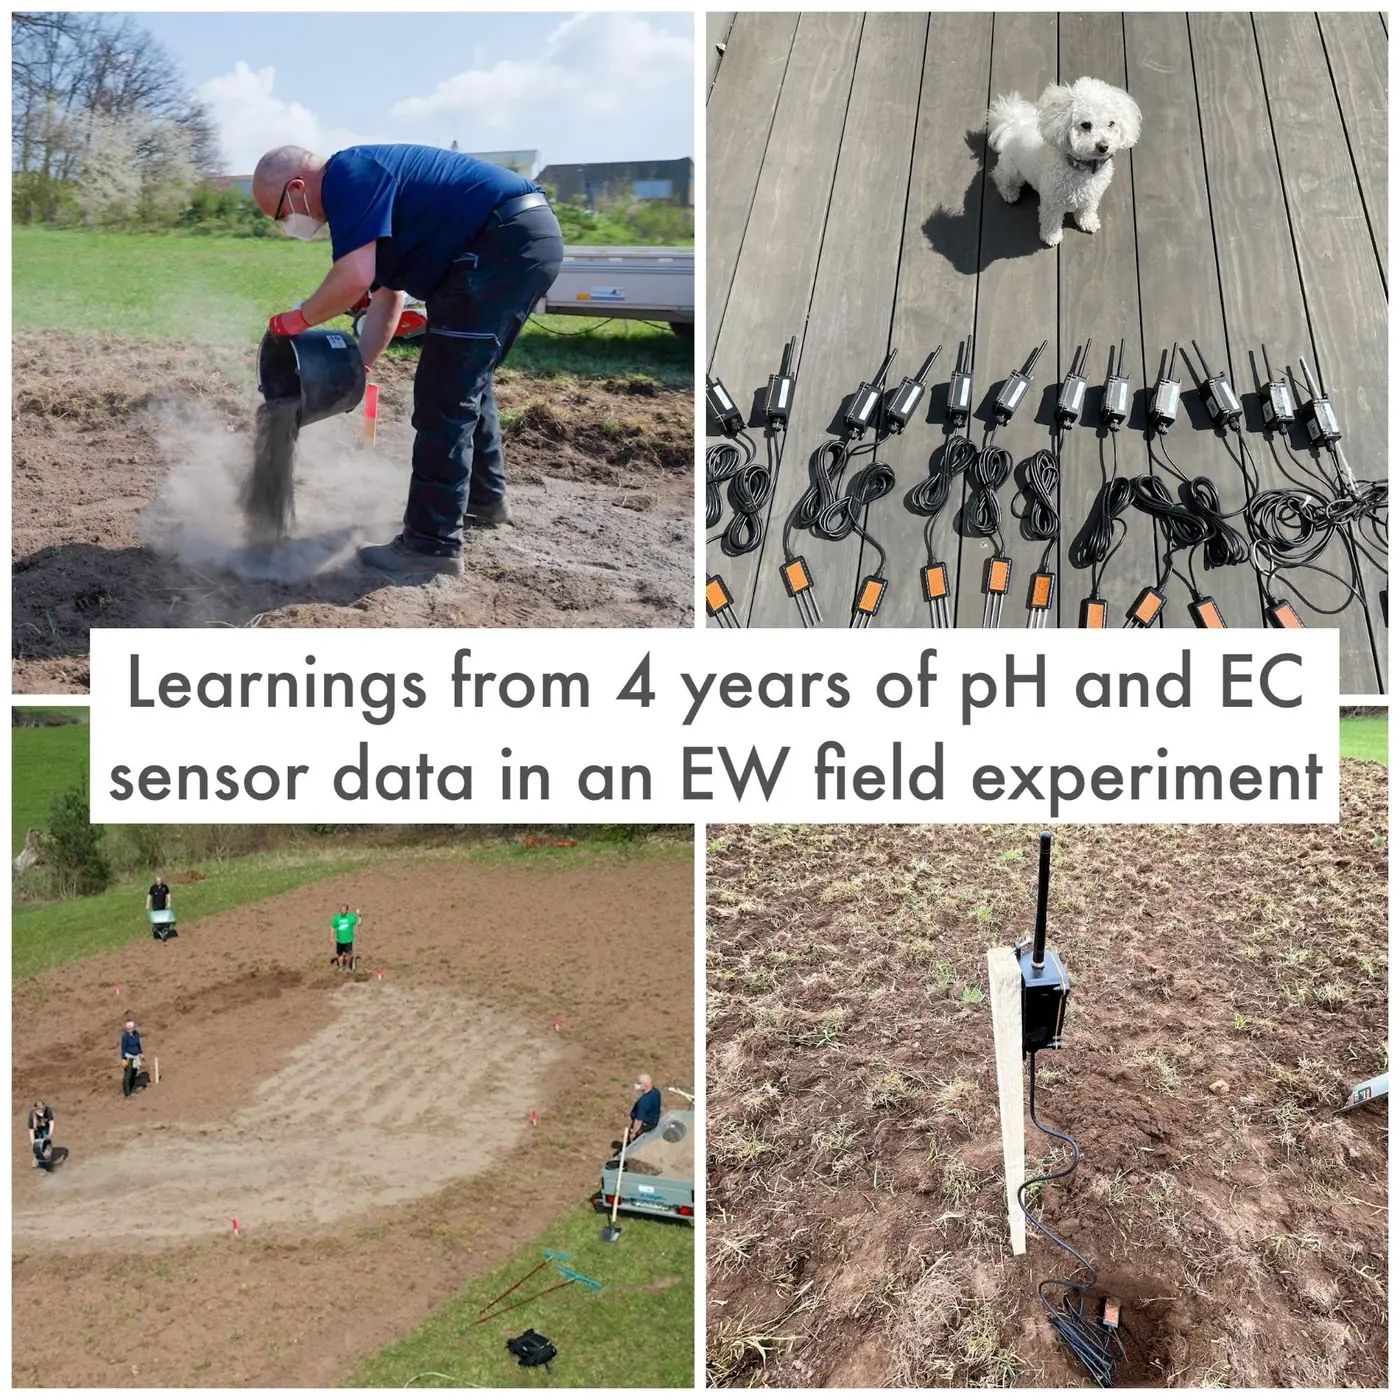
Photo impressions from the field setup in April 2021, when we spread 1.5 tons of basalt literally by hand.
The messy truth of measuring enhanced rock weathering in the real world
The graphs below show four years of electronic soil sensor data from our first ERW experiment (set up in 2021) where we created three test plots: one control (“C”) and two amended plots with 40 t/ha basalt (“1” and “2”).
We later added 200 t/ha to plot “2” in spring 2022. In each field, we installed 4 EC and moisture sensors, as well as 4 pH sensors (LoRaWAN based).
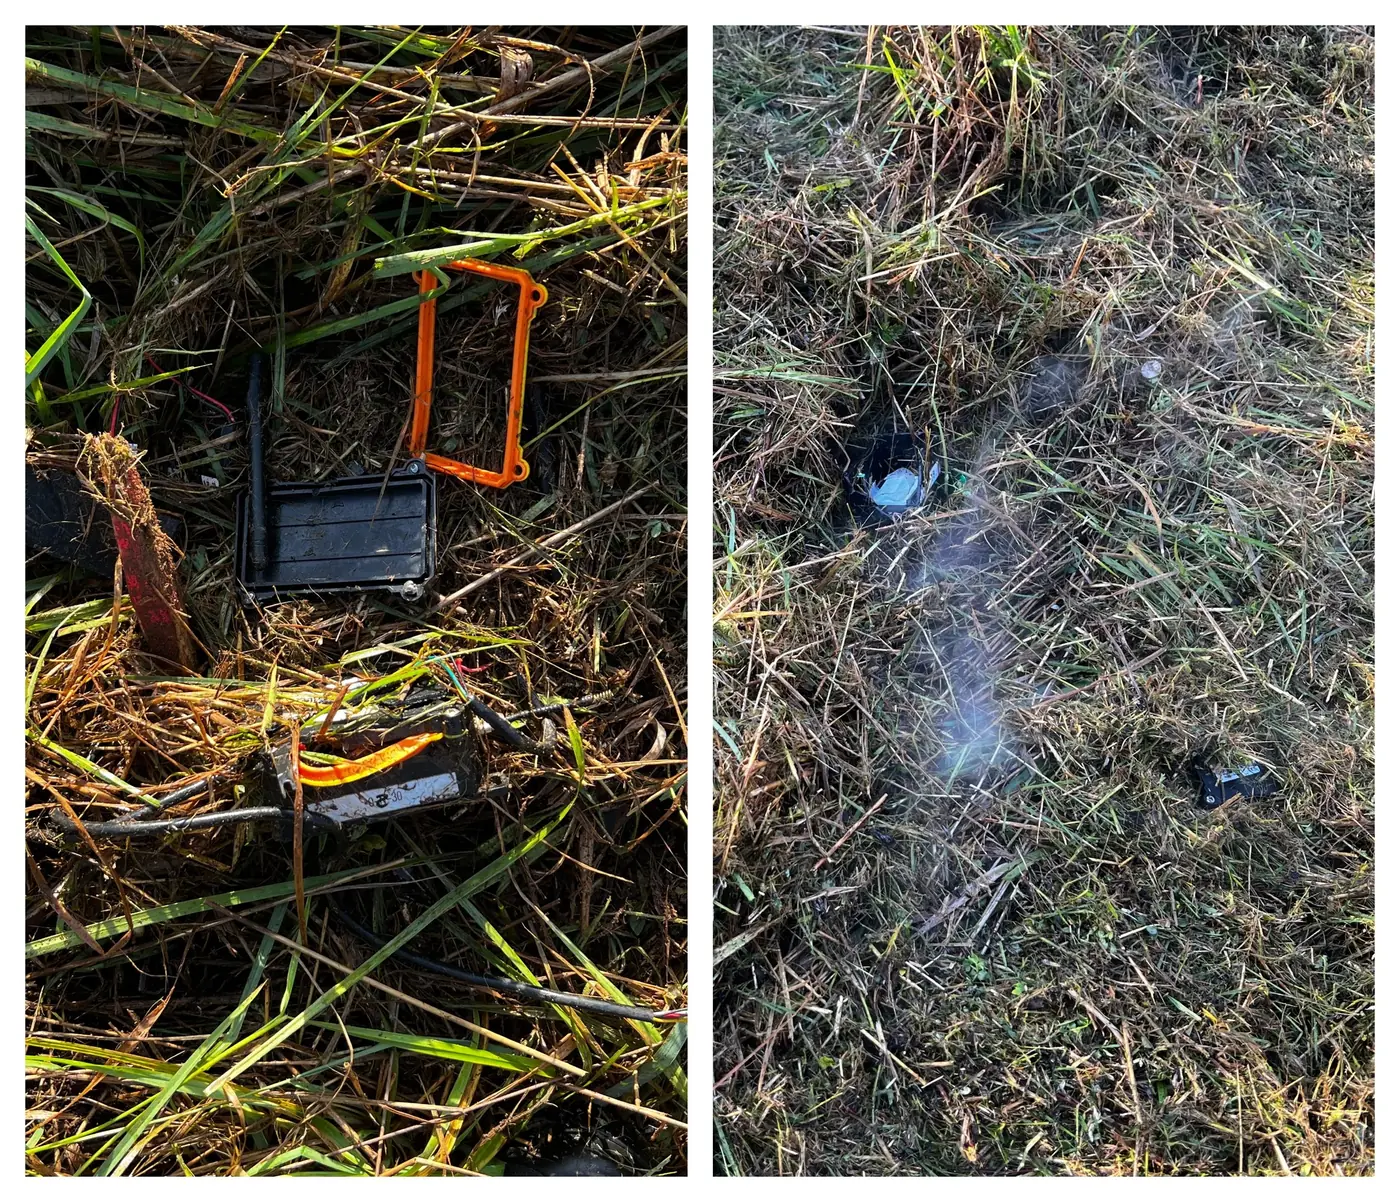
Due to the flourishing vegetation we ran over hidden antenna units with our mowing tractor. Oops!
At first, one notices that the amount of data points decreases over time. More and more sensors died — some due to empty batteries (they were advertised with a 10-year runtime), others for unknown reasons (contact corrosion etc. caused totally implausible readings, like pH 1.5), and some antenna units were accidentally chopped by our mowing tractor. You know, things that just happen in the field.
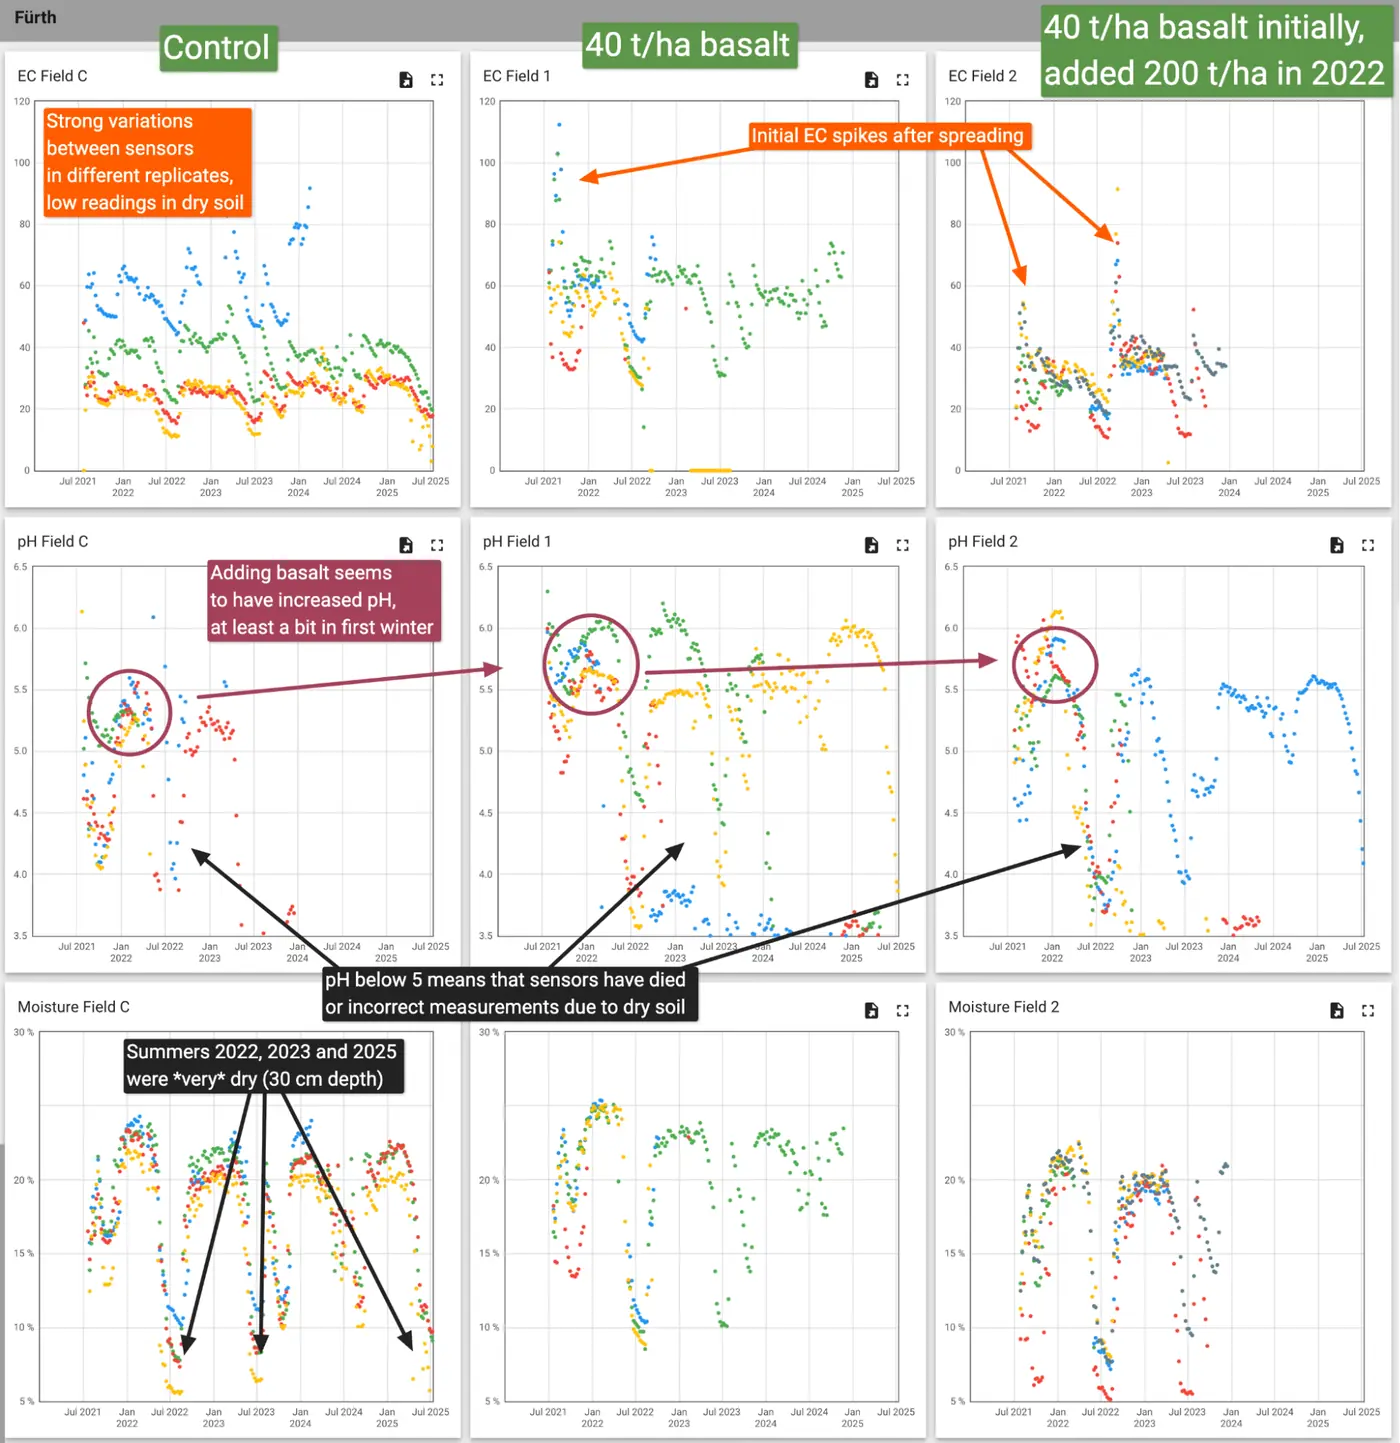
There is a huge variation between replicates, which makes interpreting the data hard from an ERW experiment perspective. One of the reasons is that the pH and EC sensors do not measure properly in very dry soil - which we had for many months almost every summer since launch of the project. We measure at 30 cm depth.
Still, some tiny bits of insights are there (see graphs):
The summers of 2022, 2023 and 2025 were particularly dry (we irrigated in the first summer of 2021). Without water, likely there was not much weathering going on for these summer half years.
The EC data is hard to interpret. Why does the 200 t/ha field show a lower EC than the 40 t/ha field? At least we can see clear initial EC spikes after the spreading events upon early rain/flush events.
With some goodwill, the data from pH sensors may show an increase in pH after spreading rock from around pH 5.3 (control) to around pH 5.7 for the treated soils (for this, we only look at the wet winter data).
When we installed the sensors four years ago, we had hoped for more ERW insights from the sensors. But as it turns out, measuring enhanced rock weathering in an open field is really hard. In later experiments in our greenhouse, we found that the soil from this field doesn‘t play well for weathering.
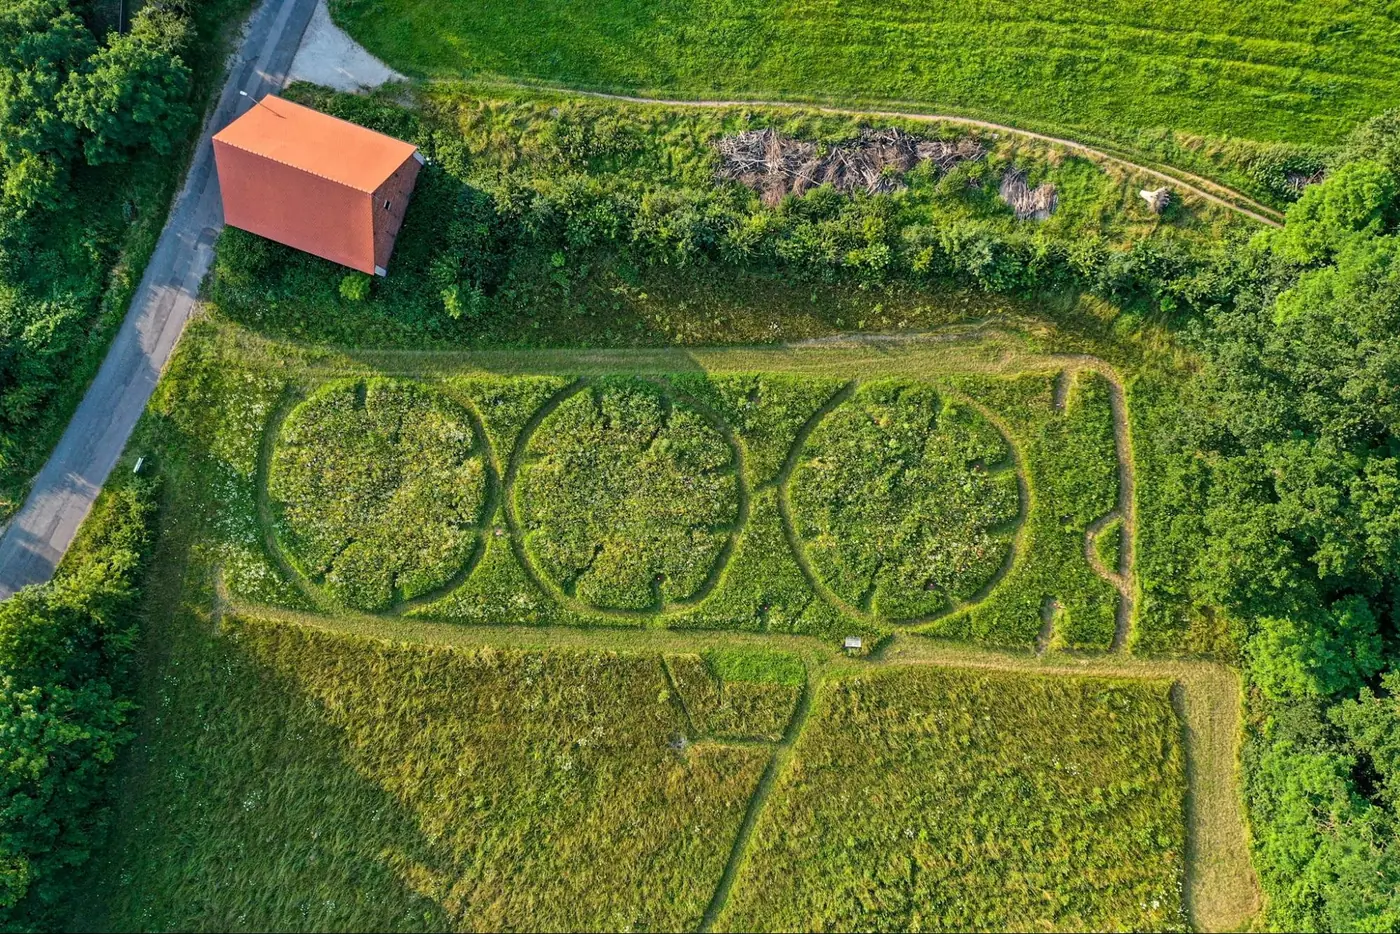
Aerial photo of the field in summer 2021